Download
1 / 39
390 likes | 453 Views
Guenter Conzelmann Center for Energy, Environmental, and Economic Systems Analysis Decision and Information Sciences Division (DIS) Argonne National Laboratory 9700 South Cass Avenue Argonne, IL 60439. Energy for Transportation and Developments in Plug-in Vehicles.

E N D
Guenter Conzelmann Center for Energy, Environmental, and Economic Systems Analysis Decision and Information Sciences Division (DIS) Argonne National Laboratory 9700 South Cass Avenue Argonne, IL 60439 Energy for Transportation and Developments inPlug-in Vehicles
Why Electric Transportation? The nation has an oil problem U.S. is refining more oil than it has, and consumes even more The current high oil prices reflect the increasing global demand for a limited energy resource: China is number 2 in oil use and India is 6th…and growing Oil is predominately a transportation energy problem, with economic, environmental, and geopolitical concerns for the nation Oil is an energy security issue Reliance on domestic oil is not sustainable, we cannot drill our way out of the problem Even optimistic projections leave us heavily dependent on foreign oil
Electric Vehicles: Are they Real? Source: EPRI, 2009)
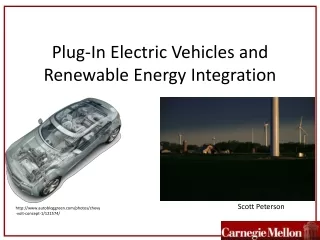
Electric Vehicles are Part of the Government-Industry Partnership Advanced Propulsion Portfolio Vision Portfolio approach as there is no clear winner Likely, the U.S. solution with include a mix of technologies with multiple fuel sources (electricity, biofuels, alternative fuels, etc.)
Existing Battery Technologies do not yet Approach the Energy and Power in an Internal Combustion (IC) Engine R&D on New Technologies is still needed
HEV, PHEV, E-REV, BEV, AEV, CS, CD, V2G, etc.: Might as well Talk to my Dog???
The Main Concepts in Simple Terms HEV: Hybrid electric vehicle (Ford Escape, Toyota Prius) Small battery, gets recharged from regenerative breaking; very limited all-electric range No plug PHEV: Plug-in Hybrid Electric Vehicle Larger battery; gets charged by plugging I Different drivetrain configurations Series: ICE turns generator which charges battery which runs electric motor (Chevy Volt) Parallel: ICE and electric motor both run the car simultaneously (Honda Insight) Mix E-REV: Extended Range Electric Vehicle A PHEV with a bigger battery for driving ranges of 40-60+ miles using only the battery (all-electric driving); after which the gas engine starts BEV: Battery Electric Vehicles Pure electric vehicles; only has an electric drivetrain When your out of battery, you are out of battery
Basic Concept of a Plug-in Electric Vehicle 10 kWh JCS Li-ion battery
Different Ways of Controlling/Operating PHEVs Engines/Batteries Blended Modes (conventional engine cycles on/off fairly frequently) All-Electric Modes (conventional engine stays off for an extended period of time until the battery charge reaches a certain level; then starts up) SOC: State of Charge (Battery)
There Will be a Substantial Cost Premium to Early Adopters; Estimates of Premium Vary Noticeably
Estimated Paybacks Can be Very Long; But the More you Drive (and the Higher the Price of Gasoline), the Better it is Source: Sharer and Rousseau, 2009, ANL
Increases in Powertrain Cost are Not the Only Cost Increases that Consumers May Need to Pay Chargers and cord and connector between vehicle and plus Charging Circuit Upgrades or Installation If you want faster charging, you will need an upgrade Level 1: Your standard circuit (110V, 20Amps, 1.1 KW) Level 2: Upgraded circuit (220V, 15 Amps, 3.3 kW) 12
Examples for In-Home Charging and Public Charge Stations 13 Source: Coulomb Technologies, 2010
How do We Use Vehicles? PHEVs with an all-electric-range (AER) of 20 Miles could cover about 40% of daily Vehicles-Miles-Traveled (VMT) on electricity PHEVs with a 30-Mile AER could cover about 55% of Daily VMTs
How do We Use Vehicles? (2) Weekday Last Vehicle Trip Ending Time Shows a Sharp Peak At 5-6 PM, Totaling 15% of Vehicles The chart shows national data. Similar patterns can be observed for different regions in the country. 15 15
How do We Use Vehicles? (3) Some variation; the hottest months have the smallest peak hour share Jan-Mar Apr-Jun Oct-Dec July-Sep 16
Worst Case: Charging Starts when People Arrive at their Homes; Will Show Grid Impacts 17 17
A Smart Vehicle-Grid Interface Configuration (Smart Grid, Smart Vehicle) will Reduce (Avoid?) System Impacts V2G
Utilities see PHEV Smart-Charging as Critical for Success Impact of PEVs on the 2020 Summer Load of Southern California Electric Power Grid Peak power will increase substantially without management Optimal management requires smart grids and smart vehicles Local circuits (blocks and neighborhoods) must be protected from overload Transformers need cooling periods at night Lifetime may be reduced Consumer education and pricing policy will be key enablers Source: SCE, 2009
Best Case: Smart-Charging Delays Start of Battery Charging, and Perfectly Fills the Load Night-time Valley 20 20
V2G: Vehicles could be an Active Component of the Future Grid Vehicle-to-Grid (V2G) is a PHEV equipped with a communications interface Control signals are sent from the grid operator to manage the flow of energy between the vehicle and the grid Changing charging rate; reversing the flow of energy to feed back to the grid depending on a variety of factors including current grid load, current amount of renewable generation, state of charge of the vehicle, and real-time energy pricing Direct load control (similar to AC programs) With true bi-directional flow capability, vehicles could provide ancillary grid services Frequency control, regulation and spinning reserves Help penetration of intermittent renewable energy generation resources (solar and wind) Another option is Vehicle-to-House (V2H) Plug-in vehicles treated as power generation resource along with solar or wind power, and controlled directly by an energy management system which controls the energy load at the home or business Some issues Automakers want dumb charging (KISS), utilities want smart charging Distribution system not built for bi-directional flows; will need infrastructure investments Communication infrastructure would have to be developed Effect of increased grid-controlled cycling on battery life time
Argonne is Analyzing Grid Integration Issues of Plug-in Hybrid Electric Vehicles New analysis initiated for DOE Total of 4 case studies at different levels of detail Western Interconnect, Illinois, New York ISO, New England ISO Involves projecting PHEV penetration, electricity demand, charging scenarios, grid and infrastructure impacts, electricity prices, and emissions Western Interconnect Model Representation 22
Summary of Recent Studies on Impacts of PHEVs on Power Systems 23 23
The Starting Point is to Estimate the Future PHEV Market using Market Simulation Tools
Estimates of Number of PHEVs on the Road in 2020 by Region About 10% of Cars and SUVs In 2020 are assumed to be PHEVs Breakdown into AER 10, 20, 30, and 40 using average typical travel pattern (NHTS) PHEV10 – 39%; PHEV20 – 29%; PHEV30 – 19%; PHEV40 - 13% Useable battery energy = 60% of rated energy Further broken down into Chicago and Rest
Load/Grid Impacts Vary due to Different Vehicle Adoption Rates and Different Urban/Rural Driving Patterns Different impacts 27
PHEV-Induced Change in Generation Mix in April:Substantially More Coal, a Little More Gas
PHEV-Induced Change in Generation Mix in July:Less Additional Coal, More Gas
Simulated Prices for Chicago Area – Week 32 (July): Different Price Impacts under Different Scenarios
Location is Important – Simulated Prices in July (Week 32) Chicago Area Mid-Illinois
Summary of Petroleum Energy and GHG Effects of All Evaluated Options: Unconstrained Charging Scenario color/pattern of marker = fuel/vehicle type color/pattern of marker = fuel/vehicle type shape of marker = electricity generation mix shape of marker = electricity generation mix size of marker = AER rating size of marker = AER rating [VMTCD/VMTtotal]PHEV10 = 19% [VMTCD/VMTtotal]PHEV40 = 51% Petroleum fuels H2 E85 EV, US Ave mix EV, NE Ave mix EV, CA Ave mix
Summary PHEVs can play a substantial role in reducing our petroleum consumption GHG emission reductions related to PHEV depend heavily on the energy/power mix, the vehicle configuration, and the choice of technology Smart-infrastructure is critical to manage the additional load on the grid PHEVs/EVs may facilitate the use of large penetration of variable, renewable resources Keep it simple for the consumer Chevy Volt Phone App 39