Download
1 / 36
360 likes | 468 Views
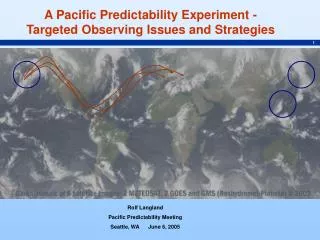
A Pacific Predictability Experiment - Targeted Observing Issues and Strategies. Rolf Langland Pacific Predictability Meeting Seattle, WA June 6, 2005. Eight years since FASTEX - first targeting field program. FASTEX Targeting Flight – Meteo France / NCAR / NRL / NOAA

E N D
A Pacific Predictability Experiment - Targeted Observing Issues and Strategies Rolf Langland Pacific Predictability Meeting Seattle, WA June 6, 2005
Eightyears since FASTEX - first targeting field program FASTEX Targeting Flight – Meteo France / NCAR / NRL / NOAA Goose Bay, Canada – 22 Feb 1997 IOP-18
Previous Targeting Field Programs • Winter storm targeting • North Atlantic (FASTEX-1997, NA-TREC-2003) • North Pacific (NORPEX-1998, WSR-1999-2005) • Hurricane / tropical cyclone targeting • North Atlantic (NOAA-HRD, 2000-2005) • Western Pacific (DOTSTAR, 2003-2005) • Participants: Meteo France, ECMWF, UKMO, NRL, NCEP, NCAR, NOAA-AOC, NOAA-HRD, USAF Hurricane Hunters, NASA, CIMSS, MIT, Univ. of Miami, Penn State Univ., others
Targeting Results • Forecast Impact of Targeted Data – (adding 10-50 dropsondes at single assimilation times) • Targeted data improves the average skill of short-range forecasts*, by ~ 10–20% over localized verification regions – maximum improvements up to 50% forecast error reduction in localized areas • In all analysis / forecast systems*, and for all targeting methodologies, it is found that ~ 20-30% of forecast cases are neutral or degraded by the addition of targeted data • Impact “per-observation” of targeted dropsonde data is large, but total impact is generally limited by the relatively small amount of targeted data * Results based on published forecast impact studies performed at NCEP, ECMWF, Meteo France, UKMO, NRL
Targeting Impact on Forecast Error (regional verification area) UPPER LIMIT SUGGESTED BY PREDICTABILITY STUDIES Average reduction in 2-day forecast error (percent) NOAA-WSR-04 NORPEX -98 NA-TReC -03 Total number of satellite or in-situ data assimilated per forecast case
How to increase the beneficial impact of Targeted Observing? ECMWF – need to observe much larger part of the SV-targeting subspace NRL - use higher-density of satellite data in target regions, observe more frequently, observe larger region (requires satellite data targeting) NCEP – ?? UKMO – ??
Targeting a major winter storm forecast failure SENSITIVITY OF 72H FORECAST ERROR TO 300mb U-WIND FORECAST VERIFICATION AREA OBSERVATION TARGETS Langland et al. (MWR, 2002)
Pacific origins of the 2000 E. Coast blizzard 21 Jan 00 22 Jan 00 23 Jan 00 24 Jan 00 25 Jan 00 26 Jan 00 250mb Daily-Mean Geopotential Height Figure by Mel Shapiro
Objectives for future targeting programs Goal 1: Increase the average beneficial impact of targeted data in deterministic and ensemble forecasts – Goal 2: Increase the percentage of forecasts that are improved by targeted data – • More data in target sub-space (fully observe the sub-space and provide near-continuous observations) • Improve targeting techniques • Improve data assimilation procedures
Pacific predictability questions -- • Are the analyses over the Pacific getting better ? • How much of the uncertainty or error that exists in current analyses over the Pacific will reduced by anticipated hyper-spectral (and other) satellite observations that will be provided over the next five to ten years? How to extract maximum benefit for NWP from this vast amount of satellite data? • - Vertical resolution of satellite data vs. that of model background • - Bias correction ? • - Observations in sensitive cloudy regions ?
NAVDAS Observation Count – 12 May 2005 All observation types - 00, 06, 12, 18 UTC Includes AMSU-A, scatterometer, MODIS, geosat winds, SSMI, raobs, land, ship, aircraft data Does not includes HIRS, AIRS, GPS, or ozone MAX SENSITIVITY Number of obs within 5o x 5o lat-lon boxes
Targeting Strategies – • How much benefit can we obtain by “tuning” the network of existing regular satellite and in-situ observations in a targeted sense? • Targeted satellite data thinning • Targeted satellite channel selection • On-request feature-track wind data • Increase observations from commercial aircraft • On-request radiosondes at non-standard times
What major scientific and technical objectives can be addressed by a Pacific predictability experiment? • Use field program data set to improve impact of satellite data for NWP (mid-latitude and tropical) • observation and background error • bias correction – calibration and validation • data thinning – channel selection • on-request targeted satellite data • Test viability of new in-situ observing systems for targeting – driftsonde, aerosonde, rocketsonde, smart balloon, etc.
of THORPEX 1. 2. 3. 4. 5. 6. 7. 8. 9. 10.
Targeting Strategy Satellite Observations In-situ observations Data Selection & Thinning Procedures Targeting Guidance Rejected Data Data Assimilation Forecast Model
Forecast and Analysis Procedure Observation (y) Data Assimilation System Analysis (xa) Forecast Model Forecast (xf) Background (xb) Adjoint of Forecast and Analysis Procedure Observation Sensitivity (J/ y) Adjoint of the Data Assimilation System Adjoint of the Forecast Model Tangent Propagator Analysis Sensitivity (J/ xa) Gradient of Cost Function J: (J/ xf) Background Sensitivity (J/ xb) Observation Impact <y-H(xb)> (J/ y) What is the impact of the observations on measures of forecast error (J) ?
Large Impact of Observations in Cloudy Regions SATWIND RAOB ATOVS Observation impact (average magnitude perobservation, in J kg-1) as a function of model-diagnosed cloud-cover. The “impact” in this figure includes both improvements and degradations of 72h global forecast error. Based on results from 29 June – 28 July 2002.
FIGURE IN EARLY VERSION OF THORPEX PLAN (April 2000) Coverage at: 00UTC 11Feb 1999 Initial Launch Time: 00 UTC 06 Feb 1999 13 launch sites Drift Level: 100 mb Launch Interval: 12hr Dropsonde Interval: 6hr Example of Driftsonde sounding coverage at one assimilation time after five days of deployment from launch sites along the Asian Pacific rim
Targeting Impact – Percent of Improved Forecasts NOAA-WSR-04 NORPEX -98 Percent of 2-day forecasts improved NA-TReC -03 Total number of satellite or in-situ data assimilated per forecast case
PROPAGATION OF PACIFIC TARGETING – SIGNAL KINETIC ENERGY From 00UTC 20 Jan 2005 (+ 7 days) EUROPE U.S. CHINA FROM S. MAJUMDAR
Research Tasks – OSEs (real data) test procedures for targeted satellite data thinning and channel selection – OSSEs (synthetic data) test impact of future satellite and in-situ observing systems – Evaluate impact oftargeted feature-track geosat wind data and other targeted satellite data - Examine 3d-var, 4d-var deterministic, TIGGE, various metrics and various forecast verification areas – Perform operational tests of driftsonde, aerosonde, rocketsonde, smart balloon, etc. for potential field program applications
Predictability Questions - Where are the most critical analysis errors or uncertainties over the Pacific? How well are cloudy regions analyzed? - Is there a benefit from using higher horizontal or vertical resolution of satellite data in target areas? - What is the realistic upper-limit of forecast improvement that can be expected from targeted observing in various situations? - What is the potential benefit from observing larger sections of the targeting subspace, instead of attempting to survey the smaller-scale areas of maximum sensitivity, which have been the primary focus of previous field programs? How can this be accomplished?
Interpretation of previous targeting results • Targeted observing has the potential for significant improvement to deterministic and ensemble forecasting • Previous targeting field programs have achieved only a small fraction of this potential – intermittent small sets of data (10-50 dropsondes) have modest beneficial impact • New and next-generation satellite data are the primary resource that can advance the impact of targeting • In-situ targeted observations provide value in certain situations where satellite observations are insufficient (including cloudy areas)
Observation Impactduring THORPEX NA-TReC 1Nov-31Dec 2003 – global domain 18UTC Does not include moisture observations or rapid-scan satellite wind data