Download
1 / 22
230 likes | 342 Views
Data Mining for Racial, Gender, and Social Economic Status Disparities in Thyroid Cancer. Sylvia Le April 29, 2010. Disparities in Health Care. Disparities in health care have serious impact on the quality of health care.

E N D
Data Mining for Racial, Gender, and Social Economic Status Disparities in Thyroid Cancer Sylvia Le April 29, 2010
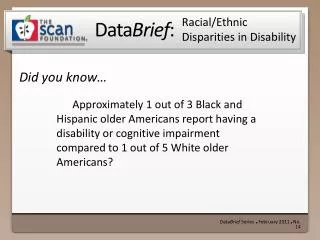
Disparities in Health Care • Disparities in health care have serious impact on the quality of health care. • Identifying health disparities may seem difficult at times, but recognition is essential. • Data mining has been used to effectively recognize several disparities in different areas of health care.
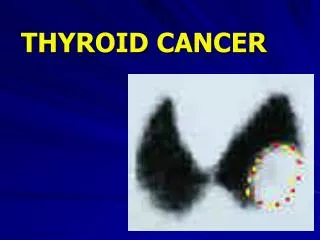
The Thyroid • The thyroid is an endocrine gland (hormone secreting and producing organ) located anterior to the trachea. • This organ secretes hormones thyroxine (T4) and triiodothyronnine (T3) which help regulate metabolism and growth. • Thyroid cancer can occur at any age, and there are over 20,000 new cases of thyroid cancer every year.
Purpose Are there race, gender, and socioeconomic disparities affecting treatment and survival for thyroid cancer patients?
SEER for Data Mining • Surveillance, Epidemiology and End Results (SEER) program of the National Cancer Institute is the data and software source for this data mining process. • Software: SEER*Stat 6.5.2 • Dataset: Incidence - SEER 17 Regs Limited-Use + Hurricane Katrina Impacted Louisiana Cases, Nov 2009 Sub (2000-2007) <Katrina/Rita Population Adjustment>
Data Selection • Only Thyroid cancer patients • from Variable Set {Site and Morphology. Site rec with Kaposi and mesothelioma} • where there exists known data for • Race - White, Black, American Indian/Alaska Native, Asian/Pacific Islander, Non-white Hispanic • Sex – Male, Female • Age - 00 - 85+ years • To limit data size and ensure the more recent information is used, only patients diagnosed from 2000 - 2006 will be used. • Information about socioeconomic status (SES) is not directly available from the patients but rather this data is calculated from US Census data by County. This variable was formed into Quintiles based on Median Household Income. • Total number of patients = 47,278.
Data Mining for Survival Disparities • Compare variables to Survival time in 6-month intervals (000-083 months) • Used SEER*Stat Frequency Session to calculate Count and Frequency (Column%) • Exported tables to .txt and visualized using Excel graphs
Survival Time vs SexCount • Observe Sex Ratio in these two kinds of stacked bar graphs. • Females make up ~75% of the thyroid cancer patients.
Survival Time vs SexFrequency • Observe that survival time has rapid decrease in the first year after diagnosis. • The two survival curves do not seem to indicate a disparity between male and female survival.
Survival Time vs RaceCount • Observe Rate Ratio in these two kinds of stacked bar graphs. • Notice whites make up ~70% of the patients.
Survival Time vs RaceFrequency • The five survival curves do not seem to indicate a disparity between races in survival. • American Indian/Alaska Native have a few unusual blips probably because their patient population is very low, making the curve susceptible to such increases/decreases.
Survival Time vs SESCount • Observe Quintile Ratio in these two kinds of stacked bar graphs. • Notice Third and FourthQuintile make up ~40% and ~55% of total number of patients.
Survival vs SESFrequency • The five survival curves do not seem to indicate a disparity between socioeconomic status and survival. • The Second Quintile has a few unusual blips for similar reasons as Native American/Alaska Native did for previous frequency graph; the patient count for this groups is very low.
Treatment vs SexCount • Observe Sex Ratio in these two kinds of stacked bar graphs. • Notice that the fraction of females is still greater, but less clear for each treatment.
Treatment vs SexFrequency • Because proportion of Radiation before and after Treatment is so large, it was removed to form the graph on the right so view other treatment graphs. • Females appear to have less IntraoperativeRadiation and Males tend to not have recommended surgeries.
Treatment vs RaceCount • Observe Race Ratios in these two kinds of stacked bar graphs. • Notice that the fraction of whites is still greater, but less clear for each treatment.
Treatment vs RaceFrequency • Because proportion of Radiation before and after Treatment is so large, it was removed to form the graph on the right so view other treatment graphs. • Several disparities seem to appear: • Blacks seem to have the most non-recommended surgeries. • American Indian/Alaska Natives most frequently seem to have no surgery due to patient refusal or other constraints..
Treatment vs SESCount • Observe Quintile Ratio in these two kinds of stacked bar graphs. • Notice that Third and FourthQuintile still make up the majority of patients, but fraction is less clear that in Survival set. • Notice also that Radiation before and after Surgery treatment makes up ~90% of all treatment counts.
Treatment vs SESFrequency • Because proportion of Radiation before and after Treatment is so large, it was removed to form the graph on the right so view other treatment graphs. • Radar graphs do not seem to indicate disparity in treatment based on socioeconomic status.
Conclusions • None of Race, Gender or SocioeconomicStatus appear to have Survival disparities. • However, several disparities can be observed with patient Treatment for Race and Gender. • Treatment does not seem to have as significant of disparities for SocioeconomicStatus.