Download
1 / 129
1.32k likes | 1.79k Views
Water Pollution. Chapter 21. Chapter 21. Identify what pollutes water and the source of the pollution. Identify the major pollution problems affecting our waterways including oceans, surface water and groundwater Determine methods to “clean up” water

E N D
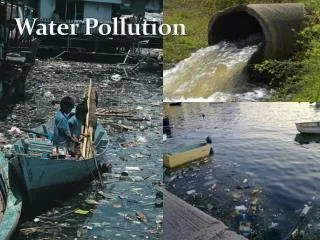
Water Pollution Chapter 21
Chapter 21 • Identify what pollutes water and the source of the pollution. • Identify the major pollution problems affecting our waterways including oceans, surface water and groundwater • Determine methods to “clean up” water • Describe state and federal water legislation
Vocabulary Words • Water pollution • point/non-point source • Biological Oxygen Demand (BOD) • Chemical Oxygen Demand (COD) • sludge • Safe Drinking Water Act • Clean Water Act • Oil Spill Prevention & Liability Act
Identifying Pollution • Which of the beakers on the front table contain polluted water? • Chlorine, specific conductance • Acid, pH • Organic constituents, lab analysis • Sediment, visual identification • Surfactants, visual identification
We All Live Downstream • “Today, everybody is downstream from somebody else,” William Ruckelshaus • What does that mean? • How does that affect your water quality?
“Frontline: Poisoned Waters” • http://video.pbs.org/video/1114515379/
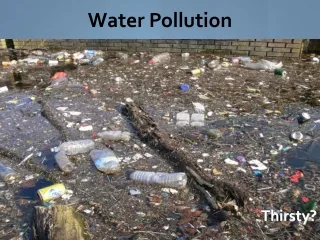
Water Pollution • Water pollution is any chemical, biological or physical change in water quality that has a harmful effect on living organisms or makes water unsuitable for desired uses. • Who decides if water is “harmful”? • What does “harmful” mean? • Which “living organisms” matter?
“All substances are poisons, there is none which is not a poison. The right dose differentiates a poison and a remedy.” Paracelsus (1493-1541)
Toxicology • The study of the interaction between chemical agents and biological systems. • Toxicity is the relative ability of a substance to cause adverse effects in living organisms.
Definitions of “harmful” • Toxic refers to a parameter, constituent to pollutant that has an LD50; in other words, it has been known to kill organisms (usually humans) • Hazardous refers to a compound which causes acute or chronic health problems, including, but not limited to, death.
The point is . . . • If the chemicals and biological agents that we use and produce as waste products were not “harmful” in some way to some population, there would be no point in studying water pollution.
The source of it all • Point source: pollution that comes from a specific location Sludge from a copper mine. Industrial discharge
Other Sources • Non-point source: pollution that occurs from multiple sources with no single polluter identified.
Who are the polluters? • The major source of 41-48% water pollution is agriculture according to the EPA. • Connect the dots from population growth, food production, water use and water pollution. • Industrial Facilities • Municipal • Mining
What is water polluted with? • Disease-causing agents • Oxygen demanding waste • Plant nutrients (NO3-, PO43-) • Organic chemicals (solvents, petroleum) • Inorganic chemicals (Fe, Pb, NH3) • Sediment • Heat
Effects of Pollution • The two major effects of water pollution are: • exposure to infectious agents from contaminated drinking water; and, • not having enough water for effective sanitation.
What is “clean” or “safe”? • The definition of clean or safe water is very dependent on it’s use and the laws that affect the source and discharge of the water. • Example: pH • RCRA: 2 > S.U. > 12.5 • SDWA: 6.5 > S.U. > 8.5 • HMTA: those substances which cause visible destruction to skin tissue
The Water • Drinking Water: Safe Drinking Water Act • Surface Water: Clean Water Act • Groundwater: CWA, RCRA as Solid Waste, CERCLA for clean-up
Surface Water • Surface Water is polluted by: • human activity • industrial activity • power plants
Water Quality • There are two classes of water quality standards: • biological • chemical
Chemical Water Quality • Water Quality Index (WQI) is a set of standard test parameters used to compare water quality all around the country. • An numerical WQI is assigned based on the results of nine (9) separate parameters
WQI Parameters • Dissolved Oxygen (DO) • pH • Temperature Change (ΔT) • Fecal Coliform • Biochemical Oxygen Demand (BOD) • Nitrates • Total Phosphates • Total Dissolved Solids (TDS) • Turbidity or Total Suspended Solids (TSS)
Q Value • Measurements of each parameter are taken and recorded and then are converted into a “Q value”
Water Quality Factor Weights • The “Q” value for each parameter is determined and multiplied by a weighting factor: • Dissolved oxygen 0.17 • Fecal coliform 0.16 • pH 0.11 • Biochemical oxygen demand 0.11 • Temperature change 0.10 • Total phosphate 0.10 • Nitrates 0.10 • Turbidity 0.08 • Total solids 0.07
Final calculation • The weighted “Q values” are added for all of the parameters and compared to a water quality index scale
The Scale • Water Quality Index Scale • 91 - 100 : Excellent Water Quality • 71 - 90 : Good Water Quality • 51 - 70 : Medium or Average Quality • 26 - 50 : Fair Water Quality • 0 - 25 : Poor Water Quality
Dissolved Oxygen • Oxygen gas is not very soluble in water. • As the temperature of a liquid increases, the solubilities of gases in that liquid decrease. • T, Solubility
Gas Solubility • We can use the Second Law of Thermodynamics to explain why. • Heating a solution of a gas enables the particles of gas to move more freely between the solution and the gas phase. • The Second Law predicts that they will shift to the more disordered, more highly dispersed, and therefore, more probably gas state.
Where does DO come from? • Most of the DO in surface water comes from contact with the atmosphere. • Splashing and flowing water traps oxygen • Photosynthetic organisms also produce oxygen
DO Test • The test for DO determines the availability of oxygen for aquatic life • A high concentration of DO indicates high water quality
Water Quality DO (ppm) at 20°C Good 8–9 Slightly polluted 6.7–8 Moderately polluted 4.5–6.7 Heavily polluted Below 4.5 Gravely polluted Below 4 Fig. 21-3, p. 496
Reference http://www.indiana.edu/~bradwood/eagles/waterquality.htm
Physical Influences on Dissolved Oxygen • Water temperature and the volume of water moving down a river (discharge) affect dissolved oxygen levels. Gases, like oxygen, dissolve more easily in cooler water than in warmer water. In temperate areas, rivers respond to changes in air temperature by cooling or warming.
Climate and DO • River discharge is related to the climate of an area. During dry periods, flow may be severely reduced, and air and water temperatures are often higher. Both of these factors tend to reduce dissolved oxygen levels. Wet weather or melting snows increase flow, with a resulting greater mixing of atmospheric oxygen.
Human-Caused Changes in Dissolved Oxygen • The main factor contributing to changes in dissolved oxygen levels is the build- up of organic wastes. • Organic wastes consist of anything that was once part of a living plant or animal, including food, leaves, feces, etc. • Organic waste can enter rivers in sewage, urban and agricultural runoff, or in the discharge of food processing plants, meat packing houses, dairies, and other industrial sources.
Farming and Dissolved Oxygen • A significant ingredient in urban and agricultural runoff are fertilizers that stimulate the growth of algae and other aquatic plants. As plants die, aerobic bacteria consume oxygen in the process of decomposition. Many kinds of bacteria also consume oxygen while decomposing sewage and other organic material in the river.
Changes in Aquatic Life • Depletions in dissolved oxygen can cause major shifts in the kinds of aquatic organisms found in water bodies. • Species that cannot tolerate low levels of dissolved oxygen-mayfly nymphs, stonefly nymphs, caddisfly larvae, and beetle larvae-will be replaced by a few kinds of pollution-tolerant organisms, such as worms and fly larvae. • Nuisance algae and anaerobic organisms (that live without oxygen) may also become abundant in waters with low levels of dissolved oxygen.
Calculating Percent Saturation • The percent saturation of water with dissolved oxygen at a given temperature is determined by pairing temperature of the water with the dissolved oxygen value, after first correcting your dissolved oxygen measurement for the effects of atmospheric pressure. This is done with the use of the correction table and the percent saturation chart.
Using the Conversion Charts • To calculate percent saturation, first correct your dissolved oxygen value (milligrams of oxygen per liter) for atmospheric pressure. Look at the correction chart. Using either your atmospheric pressure (as read from a barometer) or your local altitude (if a barometer is not available), read across to the right hand column to find the correction factor. Multiply your dissolved oxygen measurement by this factor to obtain a corrected value.
The Meaning of Percent Saturation • Rivers that consistently have a dissolved oxygen value of 90 percent or higher are considered healthy, unless the waters are supersaturated due to cultural eutrophication. • Rivers below 90 percent saturation may have large amounts of oxygen-demanding materials, i.e. organic wastes.
Biochemical Oxygen Demand (BOD) • When organic matter decomposes, it is fed upon by aerobic bacteria. In this process, organic matter is broken down and oxidized (combined with oxygen). Biochemical oxygen demand is a measure of the quantity of oxygen used by these microorganisms in the aerobic oxidation of organic matter.
Biochemical Oxygen Demand (BOD) • When aquatic plants die, they are fed upon by aerobic bacteria. The input of nutrients into a river, such as nitrates and phosphates, stimulates plant growth. Eventually, more plant growth leads to more plant decay. Nutrients, then, can be a prime contributor to high biochemical oxygen demand in rivers.
Sources of Organic Matter • There are natural sources of organic material which include organic matter entering lakes and rivers from swamps, bogs, and vegetation along the water, particularly leaf fall. • There are also human sources of organic material. When these are identifiable points of discharge into rivers and lakes, they are called point sources.
Point Sources of Organic Matter • Point sources of organic pollution include: • pulp and paper mills; • meat-packing plants; • food processing industries; • wastewater treatment plants.
Non-point Sources of Organic Matter • Urban runoff of rain and melting snow that carries sewage from illegal sanitary sewer connections into storm drains; pet wastes from streets and sidewalks; nutrients from lawn fertilizers; leaves, grass clippings, and paper from residential areas; • Agricultural runoff that carries nutrients, like nitrogen and phosphates, from fields; • Runoff from animal feedlots that carries fecal material into rivers.