Download
1 / 19
190 likes | 361 Views
RE-INTERPRETING DNA MICROARRAY DATA Sungchul Ji, Ph.D. Department of Pharmacology and Toxicology Rutgers University Piscataway, N.J. 08855 sji@rci.rutgers.edu. The Cell as the Smallest DNA-Based Molecular Computer ( S. Ji, BioSystems 52 , 123-133, 1999 ). 2. 1.

E N D
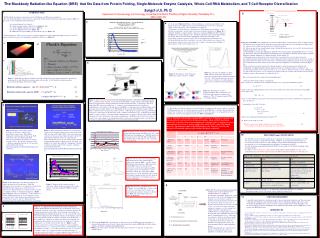
RE-INTERPRETING DNA MICROARRAY DATA Sungchul Ji, Ph.D. Department of Pharmacology and Toxicology Rutgers University Piscataway, N.J. 08855 sji@rci.rutgers.edu
The Cell as the Smallest DNA-Based Molecular Computer(S. Ji, BioSystems 52, 123-133, 1999) 2 1 Cells Brains Computers 4 3 DNA 5 Ontogeny = 1, 2 Epistemology = 3, 4, and 5
The Complementary (+/-) Relations among the various DNA and RNA molecules involved in Microarray Experiments RP RT H (+) DNA ------ > (-) mRNA ------ > (+) DNA ------- > (-) DNA. | | DNA | Polymerase RP = RNA polymerase | or RT = Reverse transcriptase | Synthesizer H = Hybridizes to; no enzymes needed | \/ (-) DNA (Used to fabricate DNA microarrays)
There are two kinds of DNA microarrays – cDNA or EST microarray and the Gene Chips. cDNA/EST microarrays are discussed first. One microarray can measure 104 mRNA levels simultaneously mRNA levels in the cell are determined by mRNA synthesis (Vsyn) and mRNA hydrolysis (Vhyd), because the rate of change in mRNA levels inside the cell is always: dR/dt = Vsyn - Vhyd Only when certain kinetic conditions are met (to be discussed later) can the DNA microarray technique measure rates of gene expression [1]. Each square can recognize one kind of mRNA molecules. DNA Microarrays
Preparation of Oligonucleotide Arrays (or Gene Chips) [2] • “Gene chips” is a phrase coined by a commercial organization Affymetric, Inc. in California. Unlike DNA microarrays that are produced by individual scientists and by biotechnology companies, gene chips are an exclusive product of Affymetric. • The technical base for producing gene chips originated from the computer chip industry and DNA synthesis lab. The key steps involved in producing gene chips are schematically shown in the next slide: • The surface of the glass base is treated with chemicals so that it can bind single nucleotides (A, T, G, or C). • In a step-wise process, each small area of the chip (also 10,000 squares each 100 micron x 100 micron) serves as the site for the synthesis of short cDNA fragments (oligonucleotides on the order of 10 to 20 nucleotides each), one nucleotide at a time. • A first mask covers most the glass surface of the chip except for all sites which are destined to contain an oligonucleotide which begins with A and these exposed sites are then coupled to adenosine (A). The next mask (after some chemistry) allows other sites to couple C; a third mask allows the coupling of T, and a final mask allows the coupling of G. The combination of all four masks completes the attachment of the first nucleotide to the glass surface. • A second nucleotide is then added to each site with four other masks. • Thus, for a chip bearing 10 base-long oligonucleotides, it is necessary to use 40 masks in all for directing each nucleotide to its proper area. • 3) Affymetric can synthesize 10,000 to 1,000,000 different oligonucleotides on each chip!
Isolate mRNA from broken cells. Synthesize fluorescently labeled cDNA from mRNA using reverse transcriptase and fluorescent nucleotides. Prepare a microarray either with EST or oligonucleotides (synthesized right on the microarray surface by Affimetric,Inc.). Pour the fluorescently labeled cDNA preparations over the microarray surface to effect hybridization. Wash off excess debris. Measure fluorescently labeled cDNA using a computer-assisted microscope. The final result is a table of numbers, each number registering the fluorescent intensity which is in turn proportional to the concentration of cDNA (and ultimately mRNA) located at row x and column y, row indicating the identity of genes, and y the conditions under which the mRNA levels are measured. How DNA Microarray Experiments are Done 1 3 2 4 5 6 5
3 Transcription inside the cell Reverse transcription inside the test tube Hybridization on the microarray surface Probably millions of cDNA molecules are adsorbed on each square on a DNA microarray. If mRNA formed inside the cell is stable, then the amount of mRNA formed during Step 1 can be estimated from the amount of cDNA bound to microarray surface in Step 3. But mRNA molecules inside the cell are unstable, because they are rapidly hydrolyzed into ribonucleotides by various ribonucleases. Therefore, it is impossible to estimate how many mRNA molecules are formed in Step 1 by measuring how many molecules of cDNA are bound to microarray surface in Step 3 (more on this later). Covalent and Noncovalent Interactions in Microarray Experiments CTAATGT (Original DNA) 1 2 3
Output Input 10 9 Gradients 5 6 4 Proteins Amino Acids 3 7 2 Ribo- nucleotides RNA 1 8 Genes Figure 1. The molecular model of the cell known as the Bhopalator [S. Ji, J. theoret. Biol. 116:399-426 (1985)].
The changes in mRNA levels of human fibroblasts (cells of connective tissues that synthesize and secrete fibrillar procollagen, fibronectin, and collagenase) measured with DNA microarrays over a time period of 24 hours. Green represents a decrease in mRNA levels (or “genes”, which term is strictly speaking incorrect; see below), black no change, and red an increase. Each mRNA molecule is represented by a single row of colored boxes, and each measuring time point is represented by a single column. Notice that the mRNA molecules belonging to cluster A started to decrease around 8 hours after beginning experiment. The mRNA molecules belonging to cluster E began to increase at around 5 hours after the beginning of the experiment. Cluster Analysis
How to Interpret DNA Microarray Data (I) • What we measure with DNA microarrays are changes in florescence intensities. • The changes in fluorescence intensities can be divided into two categories – artifactual and non-artifactual. The present state of the development of the microarray technique is such that artifactual fluorescence intensity changes account for about 50%! This is why it is a common practice to use the notion of “fold changes” referring to fluorescence intensity changes that are greater than 100% (which would be one-fold change). • Only the non-artifactual fluorescence intensities can be related to mRNA levels. • mRNA levels measured with DNA microarrays can be divided into two categories – steady state and non-steady state. The difference between these two categories of mRNA levels can be represented mathematically as follows, where R is a mRNA level and t is time: Steady state : dR/dt = 0 . . . . . . . . . . . . . . . . . . . . . . . . . . . . . . . . . . . . (1) Non-steady state: dR/dt is not zero. • The steady-state mRNA levels divide into two categories – dynamic and equilibrium. The intracellular levels of mRNA molecules are always determined by two terms – the source term (i.e., the rate of mRNA synthesis, denoted by V_syn) and the sink term (i.e., the rate of mRNA hydrolysis into smaller fragments, denoted as V_hyd): dR/dt = V_syn – V_hyd . . . . . . . . . . . . . . . . . . . . . . . . . . . . (2) There are two ways of making Eq. (2) = 0; when V_syn and V_hyd are equal, and when V_syn and V_hyd are both zero’s: Dynamic steady state: V_syn = V_hyd . . . . . . . . . . . . . . . . . . . . . . . . . . . . (3) Equilibrium steady state: V_syn = V_hyd = 0 . . . . . . . . . . . . . . . . . . . . . . . . . (4)
How to Interpret DNA Microarray Data (II) • The non-steady state mRNA levels divide into two categories: On-the-way-up: dR/dt > 0 . . . . . . . . . . . . . . . . . . . . . . . . . . . . (5) On-the-way-down: dR/dt < 0 . . .. . . . . . . . . . . . . . . . . . . . . . . . . (6) • It is probably safe to assume that V_syn is always independent of R (i.e., gene expression is turned on or off by factors other than intracellular levels of corresponding mRNA levels). But V_hyd may often depend on R, leading to the conclusion that there are at least two categories of dynmaic steady states: Zero-order dynamic steady state: V_hyd = k (R)0 = k . . . . . . . . . . . . . . . . . . (7) First-order dynamic steady state: V_hyd = k (R)1 = kR . . . . . . . . . . . . . . . . . (8) • These results can be summarized as follows: • Combining Equations (3) and (8) leads to the following useful relation: V_syn = V_hyd = kR . . . . . . . . . . . . . . . . . . . . . . . . . . . . . . . . . . . . . . . . (9) Equation (9) states that, under the conditions of the first-order dynamic steady state, the mRNA levels, R, measured with DNA microarrays are directly proportional to the rates of expression of their corresponding genes, V_syn or rates of transcript degradation. • An important corollary of Equation (9) is that, under all other conditions, there is no direct proportionality relation between mRNA levels and the rates of expression of their corresponding genes.
Six Categories of Microarray Fluorescence Intensities(Only non-artifactual fluorescence intensities, i.e., A through D, measure mRNA levels)
Table 1. The frequency distributions of the 8 modules of RNA metabolism (defined in the legend to Figure 1) as the functions of the 5 time periods following the glucose- galactose shift. If the angles are homogeneously distributed over 360°, the expected distributions can be calculated as shown in the 7th row. The p-values for the difference between the observed and the expected distributions are given in the last row. The differences are all significant, except for Mechanism 5.
Table 2. The five mechanisms (or modules) of the changes (Δ) in transcript abundances (X) in cells due to transcript synthesis (ΔXS) and transcript degradation (ΔXD) : ΔX = ΔXS – ΔXD
References: [1] Ji, S. (2004). Molecular Information Theory: Solving the Mysteries of DNA. In: Modeling in Molecular Biology (G. Ciobanu, ed.), Elsevier (in press). [2] Watson, S. J., and Akil, U. (1999). Gene Chips and Arrays Revealed: A Primer on Their Power and Their Uses. Biol. Psychiatry45:533-543.