Download
1 / 14
140 likes | 263 Views
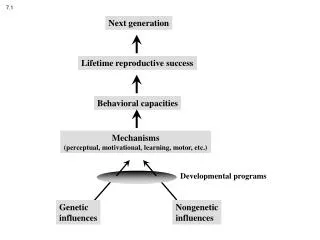
7.1 Integral as Net Change. Photo by Vickie Kelly, 2006. Greg Kelly, Hanford High School, Richland, Washington. A honey bee makes several trips from the hive to a flower garden. . The velocity graph is shown below. What is the total distance traveled by the bee?. 700 feet. 200ft. 200ft.

E N D
7.1 Integral as Net Change Photo by Vickie Kelly, 2006 Greg Kelly, Hanford High School, Richland, Washington
A honey bee makes several trips from the hive to a flower garden. The velocity graph is shown below. What is the total distance traveled by the bee? 700 feet 200ft 200ft 200ft 100ft
What is the displacement of the bee? 100 feet towards the hive 200ft 200ft -200ft -100ft
To find the displacement (position shift) from the velocity function, we just integrate the function. The negative areas below the x-axis subtract from the total displacement. To find distance traveled we have to use absolute value. Find the roots of the velocity equation and integrate in pieces, just like when we found the area between a curve and the x-axis. (Take the absolute value of each integral.) Or you can use your calculator to integrate the absolute value of the velocity function.
Every AP exam I have seen has had at least one problem requiring students to interpret velocity and position graphs. position graph Displacement: Distance Traveled: velocity graph
In the linear motion equation: V(t) is a function of time. For a very small change in time, V(t) can be considered a constant. We add up all the small changes in S to get the total distance.
As the number of subintervals becomes infinitely large (and the width becomes infinitely small), we have integration. We add up all the small changes in S to get the total distance.
This same technique is used in many different real-life problems.
The rate of potato consumption for a particular country was: where t is the number of years since 1970 and C is in millions of bushels per year. For a small , the rate of consumption is constant. The amount consumed during that short time is . Example 5: National Potato Consumption
The amount consumed during that short time is . million bushels Example 5: National Potato Consumption We add up all these small amounts to get the total consumption: From the beginning of 1972 to the end of 1973:
Work: Calculating the work is easy when the force and distance are constant. When the amount of force varies, we get to use calculus!
x= distance that the spring is extended beyond its natural length k= spring constant Hooke’s law for springs:
F=10 N x=2 M Hooke’s law for springs: Example 7: It takes 10 Newtons to stretch a spring 2 meters beyond its natural length. How much work is done stretching the spring to 4 meters beyond its natural length?
F(x) x=4 M newton-meters joules How much work is done stretching the spring to 4 meters beyond its natural length? For a very small change in x, the force is constant. p