Download
1 / 15
150 likes | 414 Views
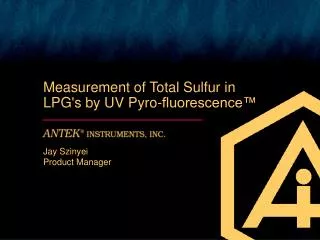
Measurement of Total Sulfur in LPG's by UV Pyro-fluorescence™ Jay Szinyei Product Manager. Pyro-fluorescence™. Reaction. R-S + O 2 1100°C SO 2 + combustion products SO 2 + h u ® SO 2 + h u ’. ¾¾®. Tygon Tubing to Pressure Sensor PCB. Rear of Instrument. Mass Flow Controllers.

E N D
Measurement of Total Sulfur in LPG's by UV Pyro-fluorescence™ Jay SzinyeiProduct Manager
Pyro-fluorescence™ Reaction R-S + O2 1100°C SO2 + combustion products SO2 + hu® SO2 + hu’ ¾¾®
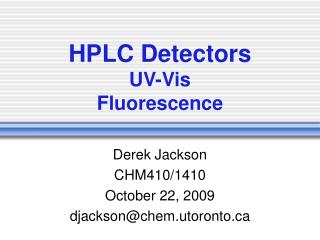
Tygon Tubing to Pressure Sensor PCB Rear of Instrument Mass Flow Controllers Sulfur Detector Carrier Loop Argon In Oxygen In Oxidative Furnace Pressure Sensor Vent Membrane Dryer Flow Diagram — D5453 Compliant Pyro-fluorescence™
argon Tygon Tubing to Pressure Sensor PCB Model 734 Injector Rear of Instrument Mass Flow Controllers LPG Sulfur Detector Carrier Loop Argon In Oxygen In Oxidative Furnace Pressure Sensor Vent Membrane Dryer Flow Diagram with Injection Module Pyro-fluorescence™
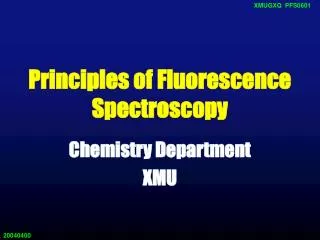
Model 9000 with 734 Gas sampling inlet system
Flow Diagram 734 gas sampling inlet
California Law A. Gasoline: ASTM D5453, sulfur by UVF, was allowed as a sulfur test method for analysis of gasoline containing less than 10 ppm and was designated as an alternative to D2622 (WDXRF) for sulfur levels above 10 ppm. B. Diesel: ASTM D5453 was established by executive order as an equivalent test method to D2622 for determining sulfur content of diesel fuel.Title 13, California Code of Regulations, Sections 2281 and 2282
Under development: Sulfur in LPG —an ASTM method using D5453 apparatus with added injection box
Under development: Sulfur in LPG —an ASTM round robin has been run
Under development: Sulfur in LPG —proposed method should pass December ballot
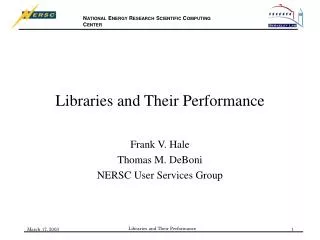
Data Summary Sample (mg/kg) Sample A B C D E F Lab 1, run 1 2.3 4.7 8.7 14.6 28.5 66.2 run 2 2.5 4.5 8.4 14.4 28.2 62.0 Lab 2, run 1 2.6 4.6 7.2 14.8 28.0 64.5 run 2 1.9 3.9 6.9 11.6 24.2 54.6 Lab 3, run 1 2.1 3.9 7.8 14.8 29.0 66.6 run 2 2.2 4.0 7.6 14.8 29.0 66.8 Lab 4, run 1 2.8 4.3 7.6 17.0 29.7 65.1 run 2 2.8 4.4 7.9 16.7 29.5 65.1 Lab 5, run 1 2.1 3.8 6.7 14.0 31.4 81.2 run 2 1.9 3.7 6.9 14.0 31.0 77.7 Lab 6, run 1 2.2 4.0 7.4 15.6 29.2 66.4 run 2 2.1 3.8 7.3 14.9 28.9 64.8 Average: 2.3 4.1 7.5 14.8 28.9 66.8 SD: 0.3 0.3 0.6 1.4 1.8 6.8
Mean Sample by Lab ppmS
Expected Value vs Mean Measured Value expected Mean Measured Value mean Expected Value
RSD By Sample RSD Samples
Real W Solutions nwww.antekhou.com orld