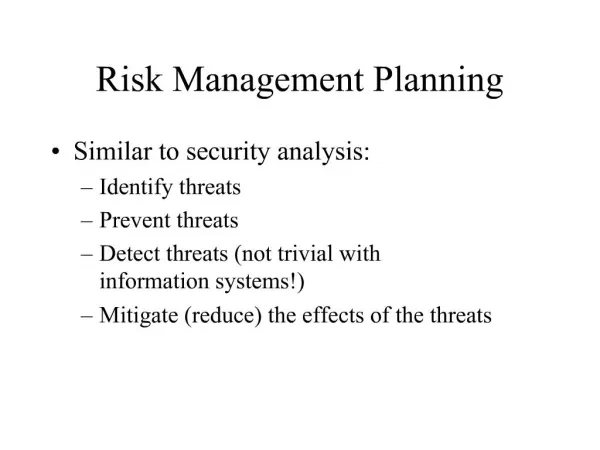
Risk to Adaptation Planning
250 likes | 462 Views
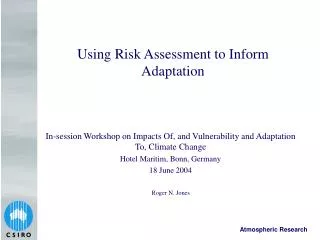
Risk to Adaptation Planning. The UK Climate Change Risk Assessment (CCRA): Methodology Tuesday, 07 th June 2011. Roger B. Street UKCIP. UK Climate Change Risk Assessment. UK CCRA Timeline. Flow Chart of Assessment Steps. Define problem / Decision criteria.

Risk to Adaptation Planning
E N D
Presentation Transcript
Risk to Adaptation Planning The UK Climate Change Risk Assessment (CCRA): Methodology Tuesday, 07th June 2011 Roger B. Street UKCIP
Flow Chart of Assessment Steps Define problem / Decision criteria Identify and Characterise Impacts Assess Vulnerability Identify Main Risks Assess Current and Future Risk Report on Risks
Identify and Characterise Impacts Method – literature review, stakeholder participation through workshops and broader stakeholder and expert elicitation Outputs • List of impacts and characterisation (magnitude, likelihood and ‘pedigree’ of supporting evidence • Sectors selected based on organisation of evidence
Characterising Impacts Based on an assessment of: • Climate effect that drove the identified risk • Description of the impacts • Consequences (in the short, medium and long term) • Whether the impact posed a threat, opportunity or was neutral • Pedigree score of the weight of evidence • Source of information about the impact • Level of confidence
Level of Confidence – Impact or Consequence IPCC Terminology Used as guidance Procedure Based on both climate effect and consequence and refers to the lowest confidence of the two. • Preliminary list scored by researchers / sector lead • Reviewed at sector workshops • Updated following peer review Note: generally accepted, but difficult to apply where research literature was limited. Used to guide the scoring of likelihood
Policy Risk Mapping • High-level description of policy landscape related to climate impacts for each sector • Using a structured approach to identify where there is an existing policy response and where there is no existing policy response • Government reviews and other documents
More Detailed Analysis of Selected Risks Conduct a simple multi-criteria assessment based on magnitude and likelihood of consequences and the urgency with which adaptation decisions need to be taken Robust and transparent selection method • qualitative information • Equally weighted and combined
Classification of Relative Magnitude Economic • Asset damage • Consequences on business and the function of the economy • Transport disruption Environmental • Valued species and biodiversity • Ecosystem services Social • Risk to life, health and wellbeing • Consequences on disadvantaged groups • Disruption of services • Cultural and symbolic consequences
Classification of Likelihood • Requires expert judgement by specific sector experts • Guided by IPCC WGII level of confidence • Considers likelihood after autonomous adaptation
Urgency of Adaptation Decision • Aims to identify those decisions required prior to 2020 and areas with a shortfall in adaptive capacity • Also deal with issues related to: • Flexibility of decisions; • Risk of ‘lock in’; and • Potential adaptation pathways
Distributional Consideration / Equity Social Vulnerability ‘checklist’ • Living in places at risk – location, type/frequency of event [exposure aspects of vulnerability] • What are socially deprived in terms of: poor health, financial resources, quality of home/workplace, and mobility in terms of transport [ sensitivity aspects of vulnerability] • Who are disempowered because of : lack of awareness; social networks; systems and support [adaptive capacity aspects] Pressure on water availability as an example risk
Incorporating Adaptive Capacity Purposes: • to inform assessment of the degree to which sectors have institutional capacity to adapt • To inform assumptions related to the degree to which autonomous adaptation will be effective
Identify Risk Metrics Selection of metrics that together broadly encapsulate the most important consequences of climate change – stakeholder / expert elicitation and verification for policy relevance • Sensitive to climate but also allow disaggregation of the effects on risk caused by climate change from effects on risk caused by socio-economic change • Presentable at geographical scales • Reflects economic, environmental and social consequences • Includes consideration of equity through social vulnerability • Relevant / legitimate to relevant Government policy Some may be quantified, some may be monetised, but others will be qualitative
Examples of Risk Metrics • Average number of people flooded per year • Number of ‘vulnerable’ people living in the floodplain • Crop water demand • Optimum crop yield • Water availability for public water supply • Ecological status • Habitat loss • Number of people suffering heat stress
Risk Metrics variation with climate Graph quantitatively or qualitatively the sensitivity of risk metrics to climate according to available evidence Approach Review existing research , including recording key assumptions and uncertainties related to conclusions Develop response functions (consequences vary with climate variables) • Present day values of the consequence metric • Change in values as the climate variable changes Most response functions will be imprecise / qualitative and based on expert elicitation Response functions will only be fully quantitative where there is evidence
Response Function - Examples Qualitative: Estimated changes in ecological status due to lower levels of dilution in summer months – expert elicitation Quantitative: Change in water availability for public water supply with increased aridity based on modelling studies for river basin areas
Monetisation Enable some comparison of risks so adaptation policy can be better targeted and enable a comparison of climate risks with other pressures Approach • Based on standard HM Treasury approaches and other approaches based on existing evidence (e.g., compensation costs) Many risks can not be monetised because of a lack of quantitative data • Non-monetised risks included in the overall assessment in a qualitative way that as far as possible indicates the relative degree of risk they represent
Two Phases of the UK CCRA Formal Risk Assessment (report to Parliament) Economic assessment of adaptation options Cycle to be repeated every five years Together inform the development of the national policy and national adaptation programmes
UK Climate Change Risk Assessment Scheduled for delivery to Parliament January 2012 Adaptation Economic Assessment – currently being tendered with expected delivery in Summer 2012 National Adaptation Programme – Late 2012