Instability Analysis in the STCC Region: Understanding Eddy Kinetic Energy Dynamics
420 likes | 538 Views
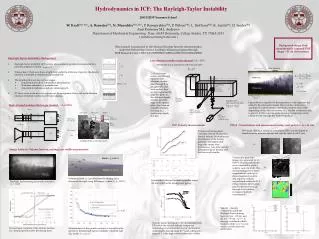
Investigate the impact of enhanced Subtropical Countercurrent (STCC) on instability through monthly runs and eddy kinetic energy analysis. Study the zonal u shear and its correlation with mean growth rate, focusing on the 135E-140E region. Utilize various approaches and literature to analyze the instability indicators.

Instability Analysis in the STCC Region: Understanding Eddy Kinetic Energy Dynamics
E N D
Presentation Transcript
Instability in the STCC region 20111014 alu
Background Qiu and Chen 2010 JPO
135E 140E Res=0.1deg (~10km) Domain:130E~179.9W(180.1),3N~33.1N Grid size:502x302x71 Flat bottom: 2000m WOA2001 monthly Temp & Saln
Zero transport(u, v=0) & free-slip BC 27N ← 33N ← Flow Relaxation Scheme and sponge zone Periodic BC Periodic BC 9N ← Zero transport(u, v=0) & free-slip BC Flow Relaxation Scheme and sponge zone 3N ← 1st 360 days: strong relaxation for spinup 2nd 360 days: no relaxation except northern and southern boundaries for instability growing ↓ 130E ↓ 180E Set up monthly runs for the region 135E~140E
0-relax Snapshots(t=0) Mar Sep elevation u & temp section@137E
Eddy kinetic Energy (averaged from 18N~25N) EKE0=eke at day 5
Averaged in upper 100m Unit: 1/days Mar May Nov Sep Kobashi et al. fig3a Averaged from 20N~25N
JPO,2011 Fig 3 Fig 4
Kobashi et al. fig6 Thermal wind relation Kobashi et al. fig15
Initial state(t=0) Aug Mar PV profile@137E dPV/dy @137E
If II is close to 0, means it reaches the most necessary condition for instability. Integrated from z0 to z200
Solid: u shear Dash: eke Qiu,1999 The pink region indicates the large u shear occurs in May, June, July. In these months, the strength of u shear is mainly contributed by upper layer STCC. However, the NEC starts retreating in these months, and the EKE analysis also shows the more stable conditions. So, the strengthening of STCC does not contribute to the instability Color: u shear in unit cm/s (u=u_surf – u_300) Contours: u_surf (positive region indicates the STCC)
Solid: u shear Dash: eke Qiu, 1999. fig10
Solid: u shear Dash: eke u_shear (u0-u300)
u_shear VS mean growth rate STCC_130135 STCC_135140 STCC_140145 STCC_145150 STCC_150155 STCC_155160 STCC_160165 STCC_165170 STCC_170175 STCC_175180
Instability analysis 從準地轉位渦平衡方程式出發 令總流場=初始(背景) 流場+perturbed 流場, 代入上式整理 BT BC 得 假設||<<1, drop J(,q)項, 考慮邊界條件w*=w0+w1+O(^2) at surf and bott, 整理得到:
u_shear VS mean growth rate Kobashi,2006,JGR
BT VS BC • Y_integ: 18N:25N • Z_integ:-400:0
BT VS BC • Y_integ: 18N:25N • Z_integ:-400:0
Order analysis (in first 100 days) Order of BT=1*2*3= 1e-14 1. order of u’: 1e-3 2. v’: 1e-4 3. dU0dy:1e-7 Order of BC=1*2*3/4=1e-12 1. order of v’: 1e-4 2. b’: 1e-4 3. M2: 1e-8 Approach A:M2=f*dU0dz a.1 f: 1e-5 a.2 dU0/dz: 1e-3 Approach B:M2=g*d(rho0/rhoref)dy b.1 g: 1e1 b.2 d(rho0/rhoref)dy:1e-9 4. N2: 1e-4 Z=0-400m Y=18-25N
dLEKE/dt (color), LEKE(black contours), EKE(red contours) case: stcc_135140, new def., upper 100m Jan May Sep Feb Jun Oct Mar Jul Nov APR Aug Dec
Literatures • Qiu, 1999 JPO: Seasonal Eddy Field Modulation of the North Pacific Subtropical Countercurrent: TOPEX/Poseidon Observations and Theory. • Kobashi et al, 2006 JGR: Three subtropical fronts in the North Pacific: Observational evidence for mode water-induced subsurface frontogenesis • Yamanaka et al, 2008 JGR: Decadal variability of the Subtropical Front of the western North Pacific in an eddy-resolving ocean general circulation model • Qiu and Chen, 2010 JPO: Interannual Variability of the North Pacific Subtropical Countercurrent and Its Associated Mesoscale Eddy Field • Xie et al,2011 JC: Dynamical Role of Mode Water Ventilation in Decadal Variability in the Central Subtropical Gyre of the North Pacific.
從準地轉位渦平衡方程式出發 令總流場=(背景)初始流場+perturbed 流場, 代入上式整理 得 假設||<<1, drop J(,q)項, 考慮邊界條件w*=w0+w1+O(^2) at surf and bott, 整理得到:
Color: map of the max growth rate in the first year (1/days) Contours: when the max growth rate occur (days), thick contour indicates 100 The NEC tail extends to the northmost in Jan and retreat to the southmost in Sep
Quantification of the movement of NEC (tail) The NEC tail extends to the northmost in Jan and retreat to the southmost in Sep Color: zonal averaged u at 200m (t=0), in unit cm/s. Contours: u = -5.5cm/s Red dot line: the exact position in latitude of the movement of the NEC(tail) in each month
Bo Qiu,1999 The pink region indicates the large u shear occurs in May, June, July. In these months, the strength of u shear is mainly contributed by upper layer STCC. However, the NEC starts retreating in these months, and the EKE analysis also shows the more stable conditions. So, the strengthening of STCC does not contribute to the instability Color: u shear in unit cm/s (u=u_surf – u_300) Contours: u_surf (positive region indicates the STCC)
Jan May Sep Feb Jun Oct Mar Jul Nov APR Aug Dec
d/dy(PV) , u, and temp Jan May Sep Feb Jun Oct Mar Jul Nov APR Aug Dec
Jan May Sep Feb Jun Oct Mar Jul Nov APR Aug Dec
u shear VS u surface(130E~180E 10 cases) Color:u shear [u0-u300] (cm/s) Contour:u surface (cm/s)
u shear VS max_growth_rate (130E~180E 10 cases) Color: u shear[u0-u300] (cm/s) Conotur: max_growth_rate (z=0-100avg) (0.05,0.1,0.15,0.2 [1/days])
BT VS BC • Y_integ: 18N:25N • Z_integ:-400:0
BT VS BC • Y_integ: 18N:25N • Z_integ:-400:0