Download
1 / 19
190 likes | 316 Views
Second workshop “Solar influences on the ionosphere and magnetosphere”. Variations of aurora emissions during substorms. V. Guineva 1 , I. Despirak 2 , R. Werner 1. 1 . Solar-Terrestrial Influences Institute, Stara Zagora Department, Bulgaria

E N D
Second workshop “Solar influences on the ionosphere and magnetosphere” Variations of aurora emissions during substorms V. Guineva1, I. Despirak2, R. Werner1 1. Solar-Terrestrial Influences Institute, Stara Zagora Department, Bulgaria 2. Polar Geophysical Institute, Apatity, Russia 7-11 June 2010, Sozopol, Bulgaria
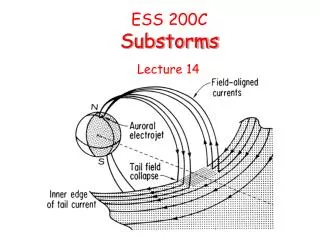
Introduction Aim of this study: To investigate the behaviour of the auroral emissions 5577Å and 6300Å and the ratio I6300/I5577 during substorms. • Peculiarities of the substorm development: • substorm expansion phase: it begins with the flash of one arc, usually the most equatorial one between the existing discrete auroral arcs; • the auroral bulge – an area occupied by bright, short-lived arcs, forms; • it is expanding in all directions, mostly toward the pole, to the West and to the East and reaches its maximum width and occupies a maximum area at the time of maximal stage of the substorm; • recovery phase: the auroral bulge begins to shrink, its polar edge moves equatorward, the bright discrete arcs degenerate into irregular strips and fade. Solar Influences on the Ionosphere and Magnetosphere, 7-11 June 2010, Sozopol, Bulgaria
Introduction It has been known that discrete auroral emissions occur at the poleward edge of the bulge ( Akasofu, 1964) that corresponds to higher energy particles and brighter emissions. But there are only a few works in which the energies of the precipitating particlesin auroras, at the polar edge and inside the auroral bulge have been compared. • Examples of meridional spectral sections taken by the C-180-S camera at Mirniy Observatory: • The polar edge is near station zenith; b) the polar edge moved to the North; c) a case when emissions spread all over the entire field of view. Zverev V.L. and Starkov G.V. (1974): a) b) c) N In our report, the emissions intensities ratio I6300/I5577 inside the auroral bulge and at its edge will be examined.For this purpose the emissions data have been compared with plasma and solar wind magnetic field data from the WIND satellite and data from the ground-based magnetic stations from the IMAGE network. Solar Influences on the Ionosphere and Magnetosphere, 7-11 June 2010, Sozopol, Bulgaria
Instrumentation • Оne photometer and two all-sky imagers (ASI) at different locations provided data of 5557 Å and 6300 Å auroral emissions. • All-sky cameras: to watch the auroral bulge position and movement and the weather conditions all-sky camera images taken simultaneously with the photometer or ASIs datahave been used. Photometer The photometer is a unique device developed at the Polar Geophysical Institute (PGI), Russia, to carry out measurements at the CapHeer Observatory (Barenzburg, Spitsbergen). The photometer has two channels for the 5557 Å and 6300 Å emissions measurements directed towards the zenith. The field of view angle of the device is 6 degrees; the objective focus distance is 40 mm. The sensitivity threshold is 2 R; the sensitivity threshold with background luminosity is 5 R. The device time resolution is 1 s. Solar Influences on the Ionosphere and Magnetosphere, 7-11 June 2010, Sozopol, Bulgaria
Instrumentation PGI All-sky camera Spitsbergen PGI all-sky camera is a standard KTV Н88М02 «VEGA» camera directed towards the zenith. The camera coverage is 180°; the sensitivity threshold is 100 R, the angular resolution is 1.25°. The sensitivity maximum of the camera coincides with the green spectral region, and the part of the red spectral region in the registered glow is less than 10%. The device time resolution is 1 s. All-sky imagers The all-sky imagers (ASI) are positioned at Andøya Rocket Range (ARR), Andenes (AND) (69.3°N, 16.03°E) and in the Auroral Observatory, Longyearbyen, Svalbard (LYR) (78.20°N, 15.83°E). Both devices are identical. The all-sky imagers have 180° field of view. The used CCD cameras are monochromatic, 512x512 pixels, with 16-bit intensity resolution and up to 10 s time resolution. The 5577 Å and 6300 Å emissions are recorded automatically with 10 s time resolution. The raw data are in counts per exposure time (sec). The raw images are accumulated in the Oslo University. Solar Influences on the Ionosphere and Magnetosphere, 7-11 June 2010, Sozopol, Bulgaria
Data used • We used the following criteria for data selection: • Presence of 5577 Å and 6300 Å intensity measurements; • Presence of a substorm at the relevant station (controlled by the IMAGE magnetometers stations chain); • 3) All-sky camera observations, presence of aurora and development of a substorm in aurora; • 4) Clear sky (no clouds). PGI photometer data during 2 substorms in the period 12.12.2007 – 12.01.2008: on 16.12.2007 and on 6.01.2008 were keeping with data selection criteria. Measurements of the ASI from the 2005-2006 observational season during 2 substorms over Andenes on 3.11.2005 and 2 substorms over Longyearbyen on 26.01.2006 suited the selection criteria. These 6 substorms are studied in this work. Solar Influences on the Ionosphere and Magnetosphere, 7-11 June 2010, Sozopol, Bulgaria
Data used Solar wind and interplanetary magnetic field parameters were taken from CDAWeb Solar Influences on the Ionosphere and Magnetosphere, 7-11 June 2010, Sozopol, Bulgaria
Results The case of 6 January 2008 is a typical example of observation of a high latitude substorm: the substorm onset was at auroral zone latitudes (Oulujärvi (OUJ) station, ~61° CGMLat), later it reached Barenzburg and moved further to the pole. Thus, Barenzburg turned out southwards of the polar edge of the bulge, i.e. inside the bulge. Solar Influences on the Ionosphere and Magnetosphere, 7-11 June 2010, Sozopol, Bulgaria
Results Behaviour of auroras by the all-sky camera at Spitsbergen (top panel)and variation of the intensities of the green line I5577, the red line I6300by PGI photometer (further down) and their ratio I6300/I5577 (bottom panel) during the substorm on 6 January 2008. Solar Influences on the Ionosphere and Magnetosphere, 7-11 June 2010, Sozopol, Bulgaria
Results Chosen all-sky camera images (top panel)and course of the intensities of the green line I5577, the red line I6300by PGI photometer (further down) and their ratio I6300/I5577 (bottom panel) during the substorm on 16 December 2007. Solar Influences on the Ionosphere and Magnetosphere, 7-11 June 2010, Sozopol, Bulgaria
Results The first substorm on 3 November 2005 at Andenes: The upper panel shows the substorm development by chosen images of the green line intensity taken from ASI. The arrow on the left image points to the North direction. The bottom panel presents the course of the green and red line intensities and their ratio during the auroral bulge development, observed in the station zenith. Solar Influences on the Ionosphere and Magnetosphere, 7-11 June 2010, Sozopol, Bulgaria
Results Development of the second substorm on 3 November 2005 at Andenes: Distribution of the 5577 Å emission by the all-sky imager (upper panel) and course of emissions intensities and their ratio in zenith (bottom panel). Solar Influences on the Ionosphere and Magnetosphere, 7-11 June 2010, Sozopol, Bulgaria
Results A substorm at Longyerbyen on 26 January 2006 the all-sky imager (upper panel) and course of emissions intensities and their ratio in zenith (bottom panel). Solar Influences on the Ionosphere and Magnetosphere, 7-11 June 2010, Sozopol, Bulgaria
Results A substorm at Longyerbyen on 26 January 2006 The upper panel shows the auroral bulge dynamics, expressed in the images of the 5577 Å emission intensity recorded by ASI. The development of the emissions and their ratio in zenith is presented in the bottom panel. Solar Influences on the Ionosphere and Magnetosphere, 7-11 June 2010, Sozopol, Bulgaria
Discussion A typical example of the behaviour of the emissions and the ratio I6300Å/I5577Å Solar Influences on the Ionosphere and Magnetosphere, 7-11 June 2010, Sozopol, Bulgaria
Discussion The emissions intensities ratio I6300/I5577 characterizes the hardness of the precipitating electrons spectrum. During the appearance of the substorm aurora near zenith, i.e. at the polar edge of the auroral bulge, the green line intensity sharply increased and the emissions intensities ratio I6300/I5577 in all examined cases reached a minimum, thus testifying for the precipitation of more energetic electrons. Therefore, the precipitation of the most energetic electrons takes place at the polar edge of the auroral bulge. Inside the bulge, both emissions are enhanced, and discrete arcs appeared. The intensities ratio during the substorm development fluctuates around a value of about 2 times higher that the one at the edge of the auroral bulge. At the same time, the I6300/I5577ratio stayslower inside the bulge than outside it. Solar Influences on the Ionosphere and Magnetosphere, 7-11 June 2010, Sozopol, Bulgaria
Discussion Our result is in agreement with the paper by Zverev et al. , 1974. In this paper it was shown, that during the auroral substorm maximum the most energetic particles are observed at the very edge of the emission band towards the pole. Their energy decreases to the equator side. Results by Zverev et al., 1974: The first 3 plots show the variation of the I(1PGN2)/I5577ratio (1) and 5577 Å intensity in relative units (2) depending on the distance to the polar edge of the auroral bulge in different moments of substorm development; the fourth plot (bottom right angle) presents the obtained average ratioI(1PGN2)/I5577. Solar Influences on the Ionosphere and Magnetosphere, 7-11 June 2010, Sozopol, Bulgaria
Conclusion On the basis of the analysis of the dynamics in the green I5577 and the red I6300 line intensities during the 6 substorms the following conclusion can be drawn: The precipitation of the most energetic electrons happens at the polar edge of the auroral bulge, inside the auroral bulge precipitation of less energetic electrons is observed. Solar Influences on the Ionosphere and Magnetosphere, 7-11 June 2010, Sozopol, Bulgaria


![【 AuroRa interactive】 [Aurora world]](https://cdn1.slideserve.com/2082289/slide1-dt.jpg)