Download
1 / 1
10 likes | 131 Views
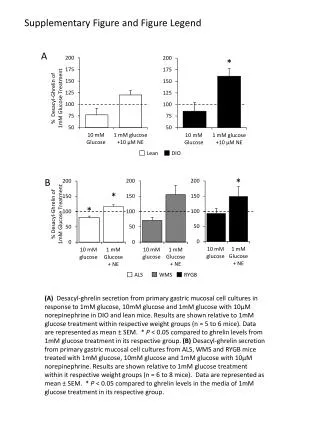
Supplementary Figure and Figure Legend. A. *. % Desacyl -Ghrelin of 1mM Glucose Treatment. ALS. Lean. WMS. DIO. RYGB. B. *. *. *. % Desacyl -Ghrelin of 1mM Glucose Treatment.

E N D
Supplementary Figure and Figure Legend A * % Desacyl-Ghrelin of 1mM Glucose Treatment ALS Lean WMS DIO RYGB B * * * % Desacyl-Ghrelin of 1mM Glucose Treatment (A)Desacyl-ghrelin secretion from primary gastric mucosal cell cultures in response to 1mM glucose, 10mM glucose and 1mM glucose with 10µM norepinephrine in DIO and lean mice. Results are shown relative to 1mM glucose treatment within respective weight groups (n = 5 to 6 mice). Data are represented as mean ± SEM. * P < 0.05 compared to ghrelin levels from 1mM glucose treatment in its respective group. (B) Desacyl-ghrelin secretion from primary gastric mucosal cell cultures from ALS, WMS and RYGB mice treated with 1mM glucose, 10mM glucose and 1mM glucose with 10µM norepinephrine. Results are shown relative to 1mM glucose treatment within it respective weight groups (n = 6 to 8 mice). Data are represented as mean ± SEM. * P < 0.05 compared to ghrelin levels in the media of 1mM glucose treatment in its respective group.