Download
1 / 42
420 likes | 445 Views
Explore probability scenarios using Venn diagrams with overlapped events to calculate outcomes easily. Enhance your understanding of statistics and probability.

E N D
1. On separate Venn diagrams of events A and B, shade the regions that represent the following: P(A) (i) P(A) P(B) (ii) P(B)
1. On separate Venn diagrams of events A and B, shade the regions that represent the following: P(A or B) (iii) P(A or B) P(A and B) (iv) P(A and B)
1. On separate Venn diagrams of events A and B, shade the regions that represent the following: P(not A) (v) P(not A) P(B only) (vi) P(B only)
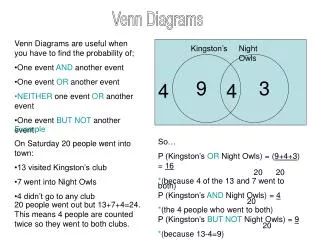
2. In a class of 30 students, 25 passed their Christmas Maths exam, 24 passed their Irish exam and 23 passed both exams. Draw a Venn diagram to represent this information and use it to calculate the probability that a student chosen at random: 30 students 25 passed Maths, 24 passed Irish 23 passed both. Only Maths = 25 – both = 25 – 23 = 2 Only Irish = 24 – both = 24 – 23 = 1
2. In a class of 30 students, 25 passed their Christmas Maths exam, 24 passed their Irish exam and 23 passed both exams. Draw a Venn diagram to represent this information and use it to calculate the probability that a student chosen at random: Neither Irish Maths Total – (Maths + Irish + both) 23 1 = 30 – (2 + 1 + 23) 2 = 30 – 26 4 = 4
2. In a class of 30 students, 25 passed their Christmas Maths exam, 24 passed their Irish exam and 23 passed both exams. Draw a Venn diagram to represent this information and use it to calculate the probability that a student chosen at random: didn’tpass maths (i) Irish Irish Maths Maths 23 23 1 1 2 2 4 4
2. In a class of 30 students, 25 passed their Christmas Maths exam, 24 passed their Irish exam and 23 passed both exams. Draw a Venn diagram to represent this information and use it to calculate the probability that a student chosen at random: passed maths or Irish but not both (ii) Irish Irish Maths Maths P (Maths only) or P (Irish only) 23 23 1 1 2 2 4 4
2. In a class of 30 students, 25 passed their Christmas Maths exam, 24 passed their Irish exam and 23 passed both exams. Draw a Venn diagram to represent this information and use it to calculate the probability that a student chosen at random: passedboth exams (iii) Irish Irish Maths Maths P(both) 23 23 1 1 2 2 4 4
2. In a class of 30 students, 25 passed their Christmas Maths exam, 24 passed their Irish exam and 23 passed both exams. Draw a Venn diagram to represent this information and use it to calculate the probability that a student chosen at random: passed maths only (iv) Irish Irish Maths Maths P(Maths only) 23 23 1 1 2 2 4 4
2. In a class of 30 students, 25 passed their Christmas Maths exam, 24 passed their Irish exam and 23 passed both exams. Draw a Venn diagram to represent this information and use it to calculate the probability that a student chosen at random: didn’tpasseither exam. (v) Irish Irish Maths Maths P(Neither) 23 23 1 1 2 2 4 4
3. Twenty-six people were surveyed about their choice of mobile phones. The survey finds that 14 people have Apple iPhones, 10 have Samsungs and five have Nokias. Four have Apple iPhones and Samsungs, three have Apple iPhones and Nokias and one has a Samsung and a Nokia. No one has all three types of phone. Represent this information on a Venn diagram and use it to calculate the probability that a person chosen at random has: 26 people 14 iPhones, 10 Samsungs, 5 Nokias 4 iPhones + Samsungs, 3 iPhones + Nokia, 1 Samsung + Nokia, 0 All 3. iPhone only 14 – (4 + 3) = 14 – 7 = 7
3. Twenty-six people were surveyed about their choice of mobile phones. The survey finds that 14 people have Apple iPhones, 10 have Samsungs and five have Nokias. Four have Apple iPhones and Samsungs, three have Apple iPhones and Nokias and one has a Samsung and a Nokia. No one has all three types of phone. Represent this information on a Venn diagram and use it to calculate the probability that a person chosen at random has: 26 people 14 iPhones, 10 Samsungs, 5 Nokias 4 iPhones + Samsungs, 3 iPhones + Nokia, 1 Samsung + Nokia, 0 All 3. Samsung only 10 – (4 + 1) = 10 – 5 = 5
3. Twenty-six people were surveyed about their choice of mobile phones. The survey finds that 14 people have Apple iPhones, 10 have Samsungs and five have Nokias. Four have Apple iPhones and Samsungs, three have Apple iPhones and Nokias and one has a Samsung and a Nokia. No one has all three types of phone. Represent this information on a Venn diagram and use it to calculate the probability that a person chosen at random has: 26 people 14 iPhones, 10 Samsungs, 5 Nokias 4 iPhones + Samsungs, 3 iPhones + Nokia, 1 Samsung + Nokia, 0 All 3. Nokia only 5 – (1 + 3) = 5 – 4 = 1
3. Twenty-six people were surveyed about their choice of mobile phones. The survey finds that 14 people have Apple iPhones, 10 have Samsungs and five have Nokias. Four have Apple iPhones and Samsungs, three have Apple iPhones and Nokias and one has a Samsung and a Nokia. No one has all three types of phone. Represent this information on a Venn diagram and use it to calculate the probability that a person chosen at random has: 26 people 7 iPhone only, 5 Samsung only, 1 Nokia only 4 iPhones + Samsungs, 3 iPhones + Nokia, 1 Samsung + Nokia, 0 All 3. None 26 – (7 + 5 + 1 + 4 + 3 + 1) = 26 – 21 = 5
3. Twenty-six people were surveyed about their choice of mobile phones. The survey finds that 14 people have Apple iPhones, 10 have Samsungs and five have Nokias. Four have Apple iPhones and Samsungs, three have Apple iPhones and Nokias and one has a Samsung and a Nokia. No one has all three types of phone. Represent this information on a Venn diagram and use it to calculate the probability that a person chosen at random has: an iPhone (i) P(iPhone)
3. Use the Venn diagram to calculate the probability that a person chosen at random has: a Samsung or a Nokia (ii) P (Samsung or Nokia)
3. Use the Venn diagram to calculate the probability that a person chosen at random has: two phones (iii) P (Two phones) = P (i Phone + Samsung) or P(i Phone + Nokia) or P (Samsung + Nokia)
3. Use the Venn diagram to calculate the probability that a person chosen at random has: no phone (iv) P(no phone)
3. Use the Venn diagram to calculate the probability that a person chosen at random has: No iPhone (v) P(no iPhone)
4. A group of 20 people are waiting at a bus stop one morning. Nine of them have an umbrella, six have a raincoat and three have both an umbrella and a raincoat. Represent this information on a Venn diagram and use it to calculate the probability that a person chosen at random has: 20 people: 9 Umbrella, 6 raincoat, 3 both. Umbrellaonly = 9 – 3 = 6 Raincoatonly = 6 – 3 = 3
4. A group of 20 people are waiting at a bus stop one morning. Nine of them have an umbrella, six have a raincoat and three have both an umbrella and a raincoat. Represent this information on a Venn diagram and use it to calculate the probability that a person chosen at random has: 20 people: 6 Umbrella only , 3 raincoat only, 3 both. None Coat Umbrella 20 – (6 + 3 + 3) 3 3 = 20 – 12 6 =8 8
4. A group of 20 people are waiting at a bus stop one morning. Nine of them have an umbrella, six have a raincoat and three have both an umbrella and a raincoat. Represent this information on a Venn diagram and use it to calculate the probability that a person chosen at random has: an umbrella (i) Coat Umbrella P(Umbrella) 3 3 6 8
4. A group of 20 people are waiting at a bus stop one morning. Nine of them have an umbrella, six have a raincoat and three have both an umbrella and a raincoat. Represent this information on a Venn diagram and use it to calculate the probability that a person chosen at random has: an umbrella and a raincoat (ii) Coat Umbrella P(Umbrella and Raincoat) 3 3 6 8
4. A group of 20 people are waiting at a bus stop one morning. Nine of them have an umbrella, six have a raincoat and three have both an umbrella and a raincoat. Represent this information on a Venn diagram and use it to calculate the probability that a person chosen at random has: an umbrella or a raincoat (iii) Coat Umbrella P(Umbrella or Raincoat) 3 3 = P(Umbrella) + P(Raincoat) − P(Umbrella and Raincoat) 6 8
4. A group of 20 people are waiting at a bus stop one morning. Nine of them have an umbrella, six have a raincoat and three have both an umbrella and a raincoat. Represent this information on a Venn diagram and use it to calculate the probability that a person chosen at random has: neither. (iv) Coat Umbrella P(neither) 3 3 6 8
5. A group of students were asked if they preferred soccer, rugby or Gaelic football. The results are shown on the Venn diagram. Calculate the probability that a randomly chosen students likes: soccer or rugby (i) Total: P (Soccer) or P (Rugby) = Rugby + Soccer
5. A group of students were asked if they preferred soccer, rugby or Gaelic football. The results are shown on the Venn diagram. Calculate the probability that a randomly chosen students likes: rugby or Gaelic football (ii) P (Rugby) or P (Gaelic) = Rugby + Gaelic
5. A group of students were asked if they preferred soccer, rugby or Gaelic football. The results are shown on the Venn diagram. Calculate the probability that a randomly chosen students likes: soccer and Gaelic football but not rugby (iii) P(Soccer and Gaelic but not Rugby)
5. A group of students were asked if they preferred soccer, rugby or Gaelic football. The results are shown on the Venn diagram. Calculate the probability that a randomly chosen students likes: onlyGaelic football (iv) P(OnlyGaelic)
5. A group of students were asked if they preferred soccer, rugby or Gaelic football. The results are shown on the Venn diagram. Calculate the probability that a randomly chosen students likes: none of these sports. (v) P(None)
6. Two events A and B have the following probabilities: P(A) = 0·4 P(B) = 0·6 P(A ∩ B) = 0·2 Draw a Venn diagram to represent these probabilities and use it to calculate: P(A\B)= 0·4 – 0·2 P(B\A)= 0·6 – 0·2 = 0·4 = 0·2
6. Two events A and B have the following probabilities: P(A) = 0·4 P(B) = 0·6 P(A ∩ B) = 0·2 Draw a Venn diagram to represent these probabilities and use it to calculate: P(A ∪ B) (i) P(A ∪ B) = P(A) + P(B) P(A ∩ B) = 0·6 + 0·4 0·2 = 0·8
6. Two events A and B have the following probabilities: P(A) = 0·4 P(B) = 0·6 P(A ∩ B) = 0·2 Draw a Venn diagram to represent these probabilities and use it to calculate: P(A ∪ B)′ (ii) P(A ∪ B)′ = 0·2
7. Let A and B be independent events, where P(A) = 0·4 and P(B) = 0·7. Find P(A ∩ B) (i) P(A ∩ B) = P(A and B) = P(A) × P(B) = 0·4 × 0·7 = 0·28
7. Let A and B be independent events, where P(A) = 0·4 and P(B) = 0·7. Find P(A ∪ B) (ii) P(A ∪ B) = P(A) + P(B) P(A ∩ B) = 0·4 + 0·7 – 0·28 = 0·82
7. Let A and B be independent events, where P(A) = 0·4 and P(B) = 0·7. Draw a Venn diagram and shade the region that represents A ∩ B′ (iii) A ∩ B′ = A\B
7. Let A and B be independent events, where P(A) = 0·4 and P(B) = 0·7. Find P(A ∩ B′) (iv) P(A ∩ B′) = P(A/B) = P(A only) = 0·4 – 0·28 = 0·12
8. A driving test consists of a practical test and theory test. One day everyone who took the test passed at least one section. 64% passed the practical section and 78% passed the theory section. 64% Practical (Pr) 78% Theory (T) 64 + 78 = 142% Pr ∩ T = 142% 100% = 42%
8. A driving test consists of a practical test and theory test. One day everyone who took the test passed at least one section. 64% passed the practical section and 78% passed the theory section. Representthis information on a Venndiagramshowing the probabilities of candidates in each section of the diagram. (i) 64% Practical (Pr) T Pr 78% Theory (T) Pr only = 64 – 42 42% 22% 36% = 22% 64 + 78 = 142% T only = 78 – 42 Pr ∩ T = 142% 100% = 36% = 42%
8. A driving test consists of a practical test and theory test. One day everyone who took the test passed at least one section. 64% passed the practical section and 78% passed the theory section. One personischosenatrandomfrom all the people whotook the test thatday. Whatis the probabilitythatthisperson: 64% Practical (Pr) T Pr 78% Theory (T) passed the practical section and the theory section? (ii) 42% 22% 36% 64 + 78 = 142% Pr ∩ T = 142% 100% P(Theory and Practical) = 42% = 42% (both = Pr ∩ T)
8. A driving test consists of a practical test and theory test. One day everyone who took the test passed at least one section. 64% passed the practical section and 78% passed the theory section. One personischosenatrandomfrom all the people whotook the test thatday. Whatis the probabilitythatthisperson: 64% Practical (Pr) T Pr 78% Theory (T) passed the theory section only? (iii) 42% 22% 36% 64 + 78 = 142% P(Theory only) = 36% Pr ∩ T = 142% 100% = 42%