Download
1 / 30
320 likes | 391 Views
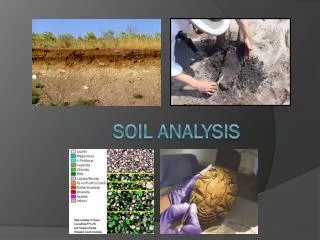
Explore innovative Pulsed Fast/Thermal Neutron-Gamma Methods for soil elemental analysis and their broad applications in various fields. Learn about neutron-gamma interactions, elemental detection processes, and system design for real-time analysis.

E N D
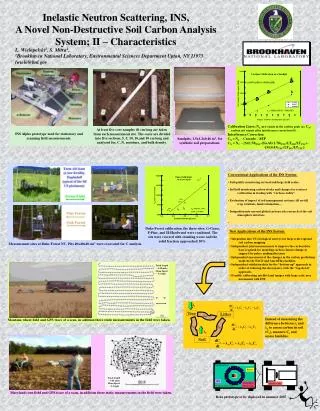
International Conference on Physics June 2016, New Orleans, LA, USA Application of the PulsedFast/Thermal Neutron-Gamma Method for Soil Elemental Analysis Alexander Kavetskiy, Galina Yakubova, H. Allen Torbert, and Stephen A. Prior National Soil Dynamics Laboratory USDA-Agricultural Research Service Auburn, AL
Neutron technology for elemental analysis • Area of application • Detection of threat material (explosives, drugs and dangerous chemicals) • Archaeological site surveys and provenance studies • Determination of elemental composition of human and animal tissues • Soil science • Real-time elemental analysis of bulk coal moving on conveyor belts • Well logging during oil exploration • Planetary science • Background of evolution • Availability of commercial products: portable pulse neutron generators, high efficiency gamma detectors, reliable electronics, and measurement processing software • Detailed knowledge of neutron interactions with nuclei (processes, neutron database of cross-sections)
Neutron-Gamma Methods • PGNAA - Prompt Gamma Neutron Activation Analysis • PFNA - Pulsed Fast Neutron Analysis • PFTNA - Pulsed Fast/Thermal Neutron Analysis(Womble et al., 1995) • PFNTS - Pulsed Fast Neutron Transmission Spectroscopy • API - Associated Particle Imaging Advantages • Non-Destructive • In situ; No sample preparation • Multi-elemental analysis of large volumes • Impact of local sharp changes in element content are negligible • Scanning capability
Neutron interaction with an atomic nucleus * General Principal of the N-G method g-rays due to Inelastic Neutron Scattering g-rays due to Thermal Neutron Capture Delay Activation g-rays Excited Nucleus Nucleus Neutron Each kind of nucleus and process produces gamma-rays of a particular energy
Scope of the Soil Element and Knowledge Importance • 1. Carbon • An universal indicator of soil quality that can impact many environmental processes, such as soil carbon sequestration, fertility, erosion, and greenhouse gas fluxes • 2. Nitrogen • Detection of dangerous hidden objects in soil (explosives) by presence of nitrogen and C/N ratio • 3. Chlorine • Detection of soil chlorine (contamination and distribution) and underground objects that contain chlorine
Fast Neutrons (14MeV) Prompt Gammas INS Gammas Delayed Gammas 0 - 50 μs Neutrons thermalize via inelastic and elastic scattering Time Separation of INS+TNC and TNC Gamma Spectrafor the Pulsed Fast/Thermal Neutron-Gamma Method Fast Neutrons (14MeV) TINS ~ ns 0 - 50 μs TTNC up to ms 0 - 200 μs Soil Neutron pulse Time INS+TNC Acquisition window Time TNC Time
Soil Carbon Measurements MC simulation screen shot Field System Geometry and Design Experimental Soil Gamma Spectra Dimensions: 75 x 23 x 95 cm3 Weight: ~ 300 kg System Components: Neutron Generator MP320 3 Gamma Detectors - NaI(Tl) Neutron Detector 4 Batteries Inverter Laptop Shielding
Problems • Presence of other soil elements • Separating the carbon peak area at 4.43 MeV from other gamma rays
The separation carbon peak area at 4.43 MeV Peak Compositions in raw INS+TNC spectrum • The main peak of interest at 4.43 MeV contains interference from the silicon gamma line • This interference can be taken into account through correlation with the 1.78 MeV peak • Gamma rays from TNC processes are present in both peaks • System background is present in both peaks
Background Measurement Peak Areas vs Height in Net INS spectra Effects of neutron interactions with soil are negligible at heights > 4 m
Net INS spectrum Net INS Spectrum = Net-INSSoil- Net-INSBkg = (INS&TNC– TNC)Soil- (INS&TNC – TNC)Bkg
The separation carbon peak area at 4.43 MeV Peak Compositions The cascade transition of excited Si at 6.23 MeV to ground state goes through the 4.50 MeV and 1.78 MeV levels 16O(n,n`α)12C* - ??? 14N(n,t)12C* - ??? • The main peak of interest at 4.43 MeV contains interference from the silicon gamma line • This interference can be taken into account through correlation with the 1.78 MeV peak
The separation carbon peak area at 4.43 MeV Extraction of the carbon signal from peak with centroid at 4.43 MeV Net INS spectra Silicon and Carbon Peak areas vs Carbon content Reference pits: 150 cm x 150 cm x 60 cm3 sand + carbon homogeneous mixture; Carbon content 0-10w% f2 = 0.054 f1 = 0.058 Net C peak areai = 4.43 MeV C peak areai - fi · 1.78 MeV Si peak areai i=1 (simulation), 2 (experiment) Si cascade transition coefficient f = 0.0547 (Herman et. al., 2007)
Problems • Effects of soil carbon distribution • Attributing the INS signal to certain soil carbon characteristics
Monte-Carlo Simulationfor different carbon distributions Carbon surface density at 30 cm = const Peak at 4.43 MeV Carbon content, gC/cm3 Depth, cm Net C peak area = 4.43 MeV C peak area - f · 1.78 MeV Si peak area ≠ const Carbon INS peak area can’t characterize the soil carbon content expressed in carbon surface density at 30 cm
Calibration of INS signal vs. different soil characteristicsfor homogeneous carbon distribution Net Carbon Peak Area = k · Carbon content vs. Surface Density in the 1-20 cm soil layer, gC/cm2 vs. average Carbon Weight % in soil layer, Cw% simulation kSD,1 = f(thickness) kw%,1 ≠ f(thickness) experiment kSD,2 = f(thickness) kw%,2 ≠ f(thickness) Which soil characterization parameter reflects the INS signal from soil with an unknown carbon depth distribution shape ?
MC Simulation and Field INS measurementsof soil with non-uniform carbon distribution Net INS spectra Carbon Distribution Field Data from dry combustion analysis and artificial Simulation AvgCw%(th)DC = f(Thickness) SD(th)DC = f(Thickness) Experiment Cw%INS,i = Net C Peak Areai/ kw%,i SD(th) INS,i = Net C Peak Areai/ kSD,i(th) i=1 (MC simulation), 2(experiment)
Comparison of INS andcarbon depth profile distribution data i=1 (MC simulation), 2(experiment) Simulation Experiment The value of carbon weight percent coincides with the average weight percent at thickness ~10 cm for any carbon distribution
INS Field Measurements Compared to Dry Combustion Depth ~ 10 cm Average by OF Experimental results demonstrate that the INS signal can be attributed to the average carbon soil content in ~10 cm upper soil layer
Comparison of INS and Dry Combustion Experimental results demonstrate that the INS signal can be assign to the average carbon soil content in ~10 cm upper soil layer
Comparison of INS and Dry Combustion Mapping of carbon content INS system Dry combustion Working Time = 2 days Working Time = 2 months Maps plotted using INS and Dry combustion data are similar
Conclusions for Carbon Measurements • A reliable mobile system based on the Pulsed Fast/Thermal Neutron-Gamma method for soil carbon measurements was developed and constructed: • The procedure for net carbon signal extraction was defined • The net carbon signal is directly proportional to the average carbon weight percent in the ~10 cm upper soil layer for any carbon distribution • The duration of one INS measurement is 30-60 minutes • The minimal measurement level of soil carbon content was estimated to be ~ 1.0 w% with standard deviation within ± 0.5 w%
Chlorine measurements • - Sources of chlorine contamination: Chlorinated hydrocarbons, components of explosive ordinance (trinitrochlorobenzene, ammonium perchlorate, and tetraaminecopper perchlorate) • The ability to detect chlorine contamination or chlorine-containing objects buried under soil quickly and remotely is desirable. • Cl-35 TNC -> 1.16 MeV-> 43 b • The field system for carbon measurement with an additional moderator is suitable for chlorine measurement Moderator Selection Dependences of the 1.16 MeV peak area vs moderator thickness TNC spectra with and w/o moderator Polyethylene moderator with thickness of 5 cm was chosen for further measurements
Chloride Surface Contamination Measurements Dependences of the 1.16 MeV peak area vs NaCl surface density The current mobile system can determine a contamination spot at levels of several tenths of a kilogram chlorine per square meter in the “pseudo”-scanning regime
Buried Chloride Object Measurements TNC spectra of the box with 6.5 kg NaCl with size 34x27x7 cm3 Dependences of the 1.16 MeV peak area vs Depth to Buried Object The current mobile system can detect objects with several kilograms of chloride buried at a depth of ~30-40 cm under the soil surface
Nitrogen Measurementsby Pulsed Fast/Thermal Neutron-Gamma Method • - The non-invasive determination of the C/N atomic or mass ratio is used for detecting explosive materials in studied objects • C-12 INS -> 4.43 MeV -> 0.42 b; N-14 TNC -> 10.82 MeV-> 0.08 b • Field system for carbon measurement is suitable for C/N measurement • Samples m=30 kg; Volume = 40x40x20 cm3; Atomic C/N=0.2 –1.2; Density = 0.96 – 0.81 g/cm3 Gamma spectra of carbon-nitrogen mixtures with different C/N ratios INS TNC
C/N measurements The ratio of the carbon (INS) to nitrogen (TNC) peaks vs C/N atomic ratio in samples The accuracy of C/N ratio determination is ± 0.03 (for comparison, the accuracy of C/N ratio determination in Mitra (2012) is ± 0.25)
Conclusions • The procedures determining soil carbon content by the Pulsed Fast/Thermal Neutron-Gamma Method were developed; • This method can define the soil carbon content in the upper soil layer much faster than the traditional dry combustion method; • This method can be used to detect chlorine contamination or chlorine-containing objects buried under soil quickly and remotely; • The accuracy of the C/N ratio determination of dangerous objects is several times better than other previously described variants of neutron-gamma analysis.
Future Work • Optimize the Pulsed Fast/Thermal Neutron System design to improvesensitivity and accuracy • Number of the detectors • Shielding • Geometry • Testing the workability of the system in the scanning regime
List of Publications Thank you! • Poster at this Conference: Monte-Carlo Gamma Response Simulation on Fast/Thermal Neutron Interactions with Soil Elements. 2016. Kavetskiy A., G. Yakubova, H.A. Torbert, and S.A. Prior. • Yakubova G., L. Wielopolski, A. Kavetskiy, H.A. Torbert, and S.A. Prior. 2014. Field Testing a Mobile Inelastic Neutron Scattering System to Measure Soil Carbon. Soil Sci. 179:529-535. • Kavetskiy A., G. Yakubova, H.A. Torbert, and S.A. Prior. 2015. Continuous versus pulse neutron induced gamma spectroscopy for soil carbon analysis. Appl. Radiat. Isotopes 96:139-147. • Yakubova, G., A. Kavetskiy, S.A. Prior, and H.A Torbert. 2015. Benchmarking the inelastic neutron scattering soil carbon method. Vadose Zone J., doi:10.2136/vzj2015.04.0056. • Kavetskiy A., G. Yakubova, S.A. Prior, and H.A Torbert. 2016. “Hot background” of the mobile inelastic neutron scattering system for soil carbon analysis. Appl. Radiat. Isotopes 106:299-311. • Yakubova, G., A. Kavetskiy, S.A. Prior, and H.A Torbert. 2016.Application of Geant4 simulation for analysis of soil carbon inelastic neutron scattering measurements. Appl. Radiat. Isotopes 113:33-39. Please, any questions? Galina Yakubova, Alexander Kavetskiy, H. Allen Torbert, and Stephen A. Prior 411 S. Donahue Dr., Auburn, AL 36832 Phone: 334-502-2758; Email: galina.yakubova@ars.usda.gov National Soil Dynamics Laboratory USDA-Agricultural Research Service Auburn, AL