
Uploaded by
keziah
1 SLIDES
153 VIEWS
10LIKES
Fig. 84 -erg
DESCRIPTION
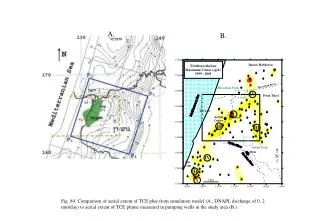
A. B. Fig. 84. Compariosn of aerial extent of TCE plue from simulation model (A.; DNAPL discharge of 0. 2 mm/day) to aerial extent of TCE plume measured in pumping wells in the study area (B.).
Download
1 / 1
Download Presentation 
Fig. 84 -erg
An Image/Link below is provided (as is) to download presentation
Download Policy: Content on the Website is provided to you AS IS for your information and personal use and may not be sold / licensed / shared on other websites without getting consent from its author.
Content is provided to you AS IS for your information and personal use only.
Download presentation by click this link.
While downloading, if for some reason you are not able to download a presentation, the publisher may have deleted the file from their server.
During download, if you can't get a presentation, the file might be deleted by the publisher.
E N D
Presentation Transcript
A. B. Fig. 84. Compariosn of aerial extent of TCE plue from simulation model (A.; DNAPL discharge of 0. 2 mm/day) to aerial extent of TCE plume measured in pumping wells in the study area (B.).


More Related