Download
1 / 14
140 likes | 242 Views
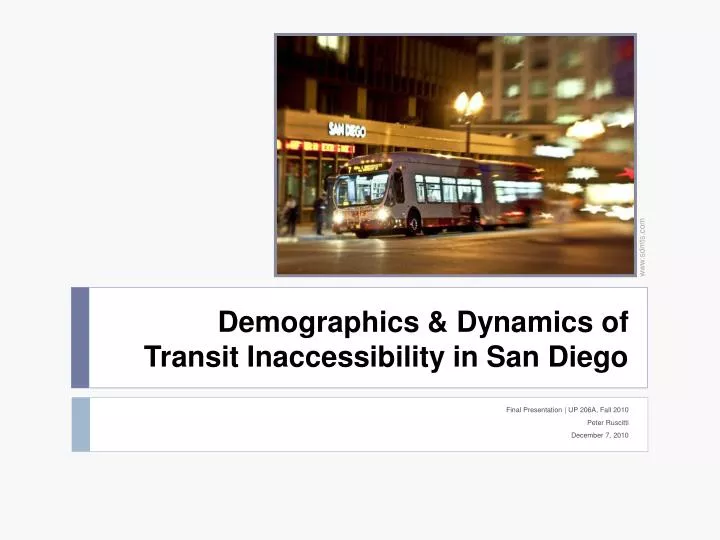
www.sdmts.com. Demographics & Dynamics of Transit Inaccessibility in San Diego. Final Presentation | UP 206A, Fall 2010 Peter Ruscitti December 7, 2010. Initial Questions (Midterm)…. Found that many employment centers are not within reasonable range of San Diego County transit system

E N D
www.sdmts.com Demographics & Dynamics of Transit Inaccessibility in San Diego Final Presentation | UP 206A, Fall 2010 Peter Ruscitti December 7, 2010
Initial Questions (Midterm)…. • Found that many employment centers are not within reasonable range of San Diego County transit system • 111,000 people with no access to any transit at workplace • Questions: • Who lives in these inaccessible areas? • What is the pollution cost of this inaccessibility? • Should the San Diego MTS/NCTD expand bus routes to serve the transit deserts?
Conclusions…. • Nearly 850,000 people live in transit deserts • Compared to 110,000 who work in them • Transit deserts tend to be areas of higher income • Generally higher elevation • Transit deserts have same rates of vehicle accessibility as transit-accessible areas • Among transit deserts, the areas most needing alternate commute options have the highest income • Thus unlikely to switch to transit (especially bus) even if offered
Skills Applied… • Modeling • Metadata • Measurement/Analysis • Original Data • Hotspot Analysis • Geoprocessing • Buffering • Index • Inset Maps • Graduated Symbology • Aggregating Attribute Fields • Boundary Sub-Sets Selections
Models Utilized… Both models were used for raster manipulation during hotspot analysis