Download
1 / 22
220 likes | 238 Views
Partial melting. 1. Binary and ternary phase diagrams; melting of the mantle. 1 - C Systems. The system SiO 2. After Swamy and Saxena (1994) , J. Geophys. Res., 99 , 11,787-11,794 . AGU. 1900. 1890. Liquid. a. 1700. b. c. Olivine. T o C. plus. Liquid. d. 1500. Olivine. 1300.

E N D
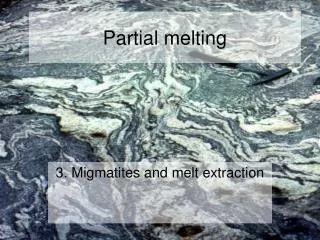
Partial melting 1. Binary and ternary phase diagrams; melting of the mantle
1 - C Systems The system SiO2 After Swamy and Saxena (1994), J. Geophys. Res., 99, 11,787-11,794. AGU
1900 1890 Liquid a 1700 b c Olivine T oC plus Liquid d 1500 Olivine 1300 1205 Fa Fo 60 20 40 80 Wt.% Forsterite The Olivine System Fo - Fa (Mg2SiO4 - Fe2SiO4) also a solid-solution series Isobaric T-X phase diagram at atmospheric pressure (After Bowen and Shairer (1932), Amer. J. Sci. 5th Ser., 24, 177-213.
2-C Eutectic Systems Example: Diopside - Anorthite No solid solution 1600 1553 Liquid Liquidus 1500 T C o 1400 Anorthite + Liquid 1392 Diopside + Liquid 1300 1274 1200 Diopside + Anorthite Di 20 40 60 80 An Wt.% Anorthite Isobaric T-X phase diagram at atmospheric pressure (After Bowen (1915), Amer. J. Sci.40, 161-185.
C = 3: Ternary Systems:Example 1: Ternary EutecticDi - An - Fo Anorthite Note three binary eutectics No solid solution Ternary eutectic = M M T Forsterite Diopside
a Liquid An An + Liq Di + Liq Di + An T - X Projection of Di - An - Fo Figure 7-2. Isobaric diagram illustrating the liquidus temperatures in the Di-An-Fo system at atmospheric pressure (0.1 MPa). After Bowen (1915), A. J. Sci., and Morse (1994), Basalts and Phase Diagrams. Krieger Publishers.
Effect of pressure Figure 7-16. Effect of lithostatic pressure on the liquidus and eutectic composition in the diopside-anorthite system. 1 GPa data from Presnall et al. (1978). Contr. Min. Pet., 66, 203-220.
Ne Volatile-free E 3GPa E 2Gpa E 1GPa Ab Highly undesaturated (nepheline - bearing) alkali basalts E 1atm Oversaturated (quartz-bearing) Undersaturated tholeiitic basalts tholeiitic basalts Fo En SiO2 Pressure effects: Figure 10-8 After Kushiro (1968), J. Geophys. Res., 73, 619-634.
Effect of water Figure 7-25. The effect of H2O on the diopside-anorthite liquidus. Dry and 1 atm from Figure 7-16, PH2O = Ptotal curve for 1 GPa from Yoder (1965). CIW Yb 64.
Figure 7-20. Experimentally determined melting intervals of gabbro under H2O-free (“dry”), and H2O-saturated conditions. After Lambert and Wyllie (1972). J. Geol., 80, 693-708.
Ne Ne Volatile-free P = 2 GPa 3GPa CO2 2GPa H2O dry 1GPa Ab Ab Highly undesaturated Highly undesaturated (nepheline-bearing) (nepheline-bearing) 1atm alkali olivine alkali olivine basalts basalts Oversaturated Oversaturated (quartz-bearing) (quartz-bearing) Undersaturated Undersaturated tholeiitic basalts tholeiitic basalts tholeiitic basalts tholeiitic basalts Fo En Fo SiO2 En SiO2 Effect of Pressure, Water, and CO2 on the position of the eutectic in the basalt system Increased pressure moves the ternary eutectic (first melt) from silica-saturated to highly undersat. alkaline basalts Water moves the (2 Gpa) eutectic toward higher silica, while CO2 moves it to more alkaline types
> 4 Components Figure 7-13. Pressure-temperature phase diagram for the melting of a Snake River (Idaho, USA) tholeiitic basalt under anhydrous conditions. After Thompson (1972). Carnegie Inst. Wash Yb. 71
Experiments on melting mantle samples: • Tholeiite easily created by 10-30% PM • More silica saturated at lower P • Grades toward alkalic at higher P Figure 10-17a. After Jaques and Green (1980).Contrib. Mineral. Petrol., 73, 287-310.
Source, melt and residuum: Tholeiitic basalt 15 Partial Melting 10 Wt.% Al2O3 Figure 10-1 Brown and Mussett, A. E. (1993), The Inaccessible Earth: An Integrated View of Its Structure and Composition. Chapman & Hall/Kluwer. 5 Lherzolite Harzburgite Residuum Dunite 0 0.8 0.4 0.6 0.2 0.0 Wt.% TiO2
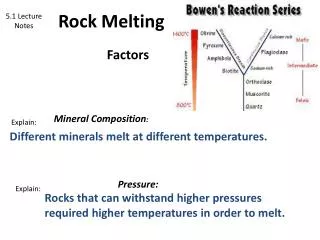
How does the mantle melt?? 1) Increase the temperature Figure 10-3
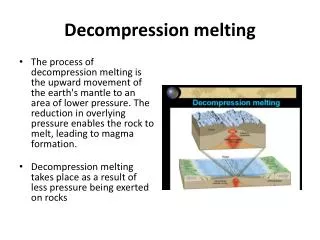
2) Lower the pressure • Adiabatic rise of mantle with no conductive heat loss • Decompression melting could melt at least 30% Figure 10-4
3) Add volatiles (especially H2O) Figure 10-5
Oblique View Isothermal Section Figure 7-8. Oblique view illustrating an isothermal section through the diopside-albite-anorthite system. Figure 7-9. Isothermal section at 1250oC (and 0.1 MPa) in the system Di-An-Ab. Both from Morse (1994), Basalts and Phase Diagrams. Krieger Publishers.