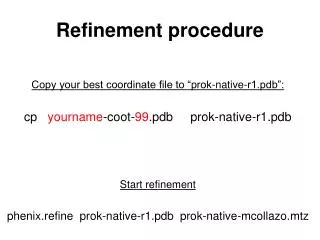
Refinement procedure
Refinement procedure. Copy your best coordinate file to “prok-native-r1.pdb”: cp yourname -coot- 99 .pdb prok-native-r1.pdb Start refinement phenix.refine prok-native-r1.pdb prok-native-mcollazo.mtz. S |F obs -F calc | S |F obs |. Structure Refinement Schematic.

Refinement procedure
E N D
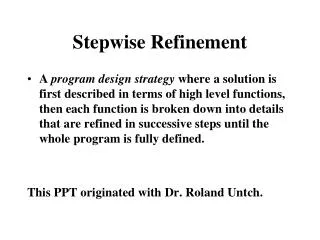
Presentation Transcript
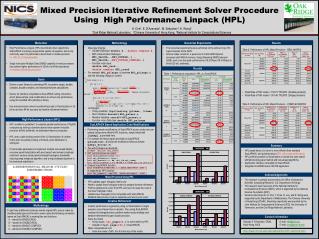
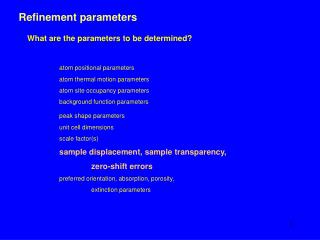
Refinement procedure Copy your best coordinate file to “prok-native-r1.pdb”: cp yourname-coot-99.pdb prok-native-r1.pdb Start refinement phenix.refine prok-native-r1.pdb prok-native-mcollazo.mtz
S|Fobs-Fcalc| S|Fobs| Structure Refinement Schematic Automatic Refinement |Fobs-native | Move atoms to |Fobs-EuCl3 | aobs Fit |Fobs| |Fobs-PCMBS | |Fcalc|out |Fcalc |in |Fcalc |in acalc Reciprocal Space FT (Coot) FT (Phenix) FT (Coot) FT (Phenix) Real Space 2Fobs-Fcalc map experimental map coordinates (prok-native-r2.pdb) coordinates (prok-native-r1_refine_001.pdb) coordinates (prok-native-r1.pdb) Build atoms to Fit Map Fobs-Fcalc map Manual Refinement Manual Refinement
Get a sorted list of Fobs-Fcalc peaks Ramachandran plot Kleywegt plot Incorrect Chiral Volumes Unmodeled Blobs Difference Map peaks Check/Delete WatersGeometry Analysis Peptide Omega Analysis Rotamer Analysis Density Fit Analysis Probe Clashes NCS differences Pukka Puckers Alignment vs. PIR
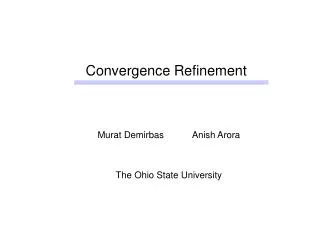
Fobs-Fcalc reveals errors in model Positive density Negative density Real Space Refine and drag Or Autofit Rotamer
Fobs-Fcalc reveals errors in model Real Space Refine and drag Or Autofit Rotamer
Goals for Today • Automated Refinement of ProK • Phenix • Rwork and Rfree for your model. • Manual Refinement of ProK • correct errors with Coot • Automated Refinement of ProK • Phenix • Rwork and Rfree for your model. • Validate ProK model (web server) • Awards • Refine ProK-PCMBS complex • Go forth wielding the tools of X-ray crystallography and discover the secrets of other biological macromolecules.
Real Space Manual Local Improvement in the model is limited by the quality of the phases Large radius of convergence Reciprocal Space Automatic Global Improved phases will lead to improved maps and improved interpretability and improved model. Small radius of convergence REAL vs RECIPROCAL
Radius of convergence • Manual adjustments improve radius of convergence Torsion angle Ca-Cb Rupp
Reciprocal Space Target function: Edata (R-factor) Move atoms to minimize the R-factor. Minimize the discrepancy between Fobs and Fcalc. Specifically, minimize E Edata=S w(Fobs-Fcalc)2Over all hkl. Past--We used least squares minimization to refine. Now--Maximum likelihood allows for non-random error model. Given this model, what is the probability that the given set of data would be observed.
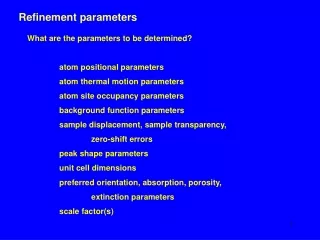
Importance of supplementing theData to Parameter Ratio in crystallographic refinement. PARAMETERS Each atom has 4 parameters (variables) to refine: x coordinate y coordinate z coordinate B factor In proteinase K there are approximately 2000 atoms to refine. This corresponds to 2000*4= 8000 variables. DATA At 2.5 A resolution we have 8400 observations (data points) (Fobs). When # of observations= # of variables A perfect fit can be obtained irrespective of the accuracy of the model. At 1.7 A resolution we have 25,000 observations. About 3 observations per variable. The reliability of the model is still questionable. Adding stereochemical restraints is equivalent to adding observations
Automated Refinement (distinct from manual building) Two TERMS: Etotal = Edata(wdata)+ Estereochemistry Edatadescribes the difference between observed and calculated data. wdatais a weight chosen to balance the gradients arising from the two terms. Estereochemistrycomprises empirical information about chemical interactions between atoms in the model. It is a function of all atomic positions and includes information about both covalent and non-bonded interactions.
Estereochemistry (Geometry) • BOND LENGTHS & ANGLES have ideal values. Engh & Huber dictionary. • -CHIRALITY of a-carbons • PLANARITY of peptide bonds and aromatic side chains • NONBONDED CONTACTS -two atoms cannot occupy the same space at the same time • TORSION ANGLE PREFERENCES side chains have preferred rotamers. • some values of f and y are forbidden. -Ramachandran. Not restrained- used for validation. loop_ _chem_comp_bond.comp_id _chem_comp_bond.atom_id_1 _chem_comp_bond.atom_id_2 _chem_comp_bond.type _chem_comp_bond.value_dist _chem_comp_bond.value_dist_esd ALA N CA single 1.458 0.019 ALA CA CB single 1.521 0.033 ALA CA C single 1.525 0.021 ALA C O double 1.231 0.020 e
Jeopardy clue:The appearance of the atomic model when stereochemical restraints are not included in crystallographic refinement. Etotal =Estereochemistry + wdataEdata What is spaghetti, Alex?
2nd Jeopardy clue:The value of the R-factor resulting when stereochemical restraints are not included in crystallographic refinement. Etotal =Estereochemistry + wdataEdata What is zero, Alex?
The need for Cross-Validation An atomic model should be validated by several unbiased indicators Low RMS deviations in bond lengths and angles does not guarantee a correct structure Rfreeis an unbiased indicator of the discrepancy between the model and the data. The data used in this R-factor calculation were not used in determining atomic shifts in the refinement process. Ramachandran plotis unbiased because phi and psi torsion angles are not restrained in the refinement process.
Stop Here • Now, use COOT to correct errors in Phenix refined model: • prok-native_refine_001.pdb • Spend 15 minutes • Run Phenix after COOT • Resume discussion on structure validation while Phenix is running.
BACKBONE AMIDE O N H
BACKBONE AMIDE O N H H H BAD 2.8 Å O N Asn
BACKBONE AMIDE O N H GOOD 2.8 Å H O N H Asn
ERRAT examines distances between non-bonded atoms. Reports the deviations of C-C, C-N, C-O, N-N, N-O, O-O distances from distributions characteristic of reliable structures.
Verify 3D plot • Indicates if the sequence has been improperly threaded through the density. • It measures the compatibility of a model with its sequence. • Evaluate for each residue in the structure: • Surface area buried • (2) Fraction of side-chain area covered by polar atoms • (3) Local secondary structure • and compare to ideal library values for each amino acid type. Correct trace Backwards trace Report the fraction of residues with score greater than 0.2
Submit coordinates to SAVS server • Google for “UCLA SAVES” • Continue with discussion on solving the ProK-PCMBS complex structure.
Hg SO3 Plan for today: Solve structure of ProK-PCMBS complex H S F Cl ProK active site Cys74 PMB: p-chloromercuribenzoylsulfonate
The beauty of isomorphism r(x,y,z)=1/V*S|Fobs|e-2pi(hx+ky+lz-fcalc) • Initial phases: phases from native proteinase K structure fcalc ProK. • Fobs amplitudes: Use |FProk-PCMBS| data measured earlier in the course. Riso=15.2% What is maximum possible Riso? What is minimum possible Riso? • Why don’t we have to use Heavy atoms? • Why don’t we have to use Molecular Replacement?
Fo-Fc Difference Fourier map r(x,y,z)=1/V*S|Fobs-Fcalc|e-2pi(hx+ky+lz-fcalc) • Here, Fobs will correspond to the Proteinase K-PMSF complex. • Fcalc will correspond to the model of Proteinase K by itself after a few cycles of automated refinement. • Positive electron density will correspond to features present in the PMSF complex that are not in the native structure. • Negative electron density will correspond to features present in the native structure that should be removed in the inhibitor complex. • After model building, do more automated refinement and then validate.
4 Key Concepts • When to use isomorphous difference Fourier to solve the phase problem. • How to interpret an Fo-Fc Difference Fourier map. • Expected values of RMS deviation from ideal geometry • methods of cross-validation
Validate protein structure by Running SAVES server grep -v hex prok-native_refine_001.pdb >prok-pmsf.pdb
O Ca O peptide plane peptide plane C N C N Ca Ca Ca LOTS OF FREEDOM! Steric CLASH R R R R Cis vs. Transpeptide
O peptide plane C N Ca Ca H R Cis OK with glycine or proline O peptide plane C N Ca Ca R Steric hindrance equivalent for cis or trans.
O peptide plane C N Ca Ca R Steric hindrance equivalentfor cis or trans proline O peptide plane Ca Cd Cb Cg C N Cg Cb Cd Ca R .