Optimizing Integrated Distribution and Production Planning in Supply Chain Management
This document explores the integration of distribution planning (DP) and production planning (PP) within Supply Chain Management (SCM) to enhance overall efficiency. Traditionally, DP and PP have operated independently, aiming for localized optimizations. However, by aligning these processes, organizations can achieve global optimal solutions, resulting in reduced sourcing costs, improved customer service, minimized inventory levels, and better resource utilization. It includes a detailed problem scenario that analyzes a supply chain system with multiple distribution centers and production plants, employing optimization techniques like linear and mixed-integer programming.

Optimizing Integrated Distribution and Production Planning in Supply Chain Management
E N D
Presentation Transcript
Integrated Distribution & Production Planning(DP/PP) EGN 5623 Enterprise Systems Optimization(Professional MSEM)Fall, 2011
Integrated Distribution Planning & Production Planning (DP/PP) Theories & ConceptsEGN 5623 Enterprise Systems Optimization(Professional MSEM)Fall, 2011
SCM aims at managing and optimizing the information flow and the material flow through a network of suppliers, manufacturers, distributors, and customers. SCM Overview
Traditionally, distribution planning and production planning are carried out, independent of each other. Each seeks its own local optimum. • In SCM, distribution planning and production planning decisions should be integrated to promote global optimum. • This integrated distribution and production planning aims at : • Reducing the costs for sourcing products and raw materials, • Improving customer service, • Dramatically reducing on-hand stocks, and • Making better use of company resources. SCM Overview
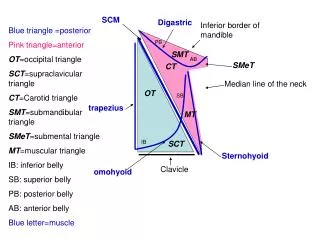
An integrated DP and PP problem: • Suppose a supply chain system contains two distribution centers (XXW1 and XXW2) and two plants (XX01 and XX02). There are two finished products for selling: GIN and KORN. GIN is produced in both plants XX01 and XX02, and KORN is only produced in plant XX02. The key semi-finished good for both products is ALC, which is only produced in plant XX01 and can be sent from the plant XX01 to XX02. The DC XXW1 is supplied from both plant and DC XXW2 is supplied only by XX02 (see the Figure 10.1) • This is a classical transportation problem. An Integrated DP/PP Problem
Some planning decisions include: • Determine the source for warehouse XXW1: • Procure GIN from XX01 or XX02, depending on the load in plants XX01 and XX02. • Prioritize production for plant XX02: • Produce GIN for both warehouses XXW1 or XXW2, depending on whether XX01 has the capacity to supply additional quantities to XXW1. • Prioritize the production in plant XX02: • Produce GIN or KORN, depending on the product priorities. An Integrated DP/PP Problem
Handle ALC: • to ship ALC to XX02 or process it in XX01, depending on the production costs, the market and the product priorities and the demand structure in XX02. • Balance the loads for GIN between plants XX01 and XX02 • depending on the production costs, the lot size dependent production costs and the capacity extension costs and possibilities. • Make trade off • To optimize the lot size that strikes a balance between set-up cost and storage cost, while improving sales flexibility. An Integrated DP/PP Problem
Objective: • The SNP optimiser is to plan the entire supply chain (i.e., from distribution, production to procurement) at optimal costs by modelling the complete supply chain as linear equations and solve them by linear programming (LP) or mixed integer linear programming (MILP). • The difference between the two (LP and MILP) lies in the consideration of discrete decisions, as lot size intervals. The SNP Optimiser
Objective function: • Min {Sproduct[(D –S) * Penalty + S * Cost supplychain]} • where • D: the total demand quantity; • S: total supply quantity (which is product and location dependent). • The supply chain costs contain cost for production, procurement, transport, storage and handling. • The penalties are cost for lateness, non-delivery and safety stock violation. • SNP optimizer considers only one time interval at a time. The SNP Optimiser
The constraints for the plants are: • PGIN-XX01<= CGIN-XX01 • PGIN-XX02 + PKRON-XX02 <= CGIN-KRON-XX02 • PGIN-XX02<= CGIN-XX02 • PKRON-XX02 <= CKRON-XX02 • PALC-XX01<= CALC-XX01 • PGIN-XX01+ PGIN-XX02+ PKRON-XX02 <= BOM Ration * PALC-XX01 • Where • P: is the produced quantity, • C: is the production capacity. The SNP Optimiser
The penalties for non-delivery and lateness are maintained in the product master either globally or locally (by product-location). • The supply chain costs are maintained in the master data for product, PDS, PPM, resource capacity variant and transportation lane. • The SNP optimiser takes the production, transport, storage and handling costs into account for global optimization. The SNP Optimiser
By setting these costs, we can model for decisions such as: • Extend production capacity in a plant or procure from a different plant considering increased production and transport costs, • Extend production capacity in a plant or procure externally • Switch to a more expensive transport method to speed up the transportation, • Switch to another source if a transport capacity is already consumed, and • Produce and ship just in time to minimise storage costs. • The more sourcing alternatives exists, the more complicated the planning problem becomes. The SNP Optimiser
Cost are used in SNP optimization to define the objective function. • Related SNP costs are listed in Table 10.2 The SNP Costs
The penalty costs for safety stock are defined with the number of stock-out days. The storage costs are calculated as stock quantity multiplied by the number of time buckets (or in addition, multiplied by the number of days per bucket), according to the setting. Costs for delay and non-delivery are maintained in the product master, for three demand types, corresponding to the demand priorities (set in the optimiser profile per demand type): 1: customer demand, 5: corrected forecast demand, and 6: forecast demand. The SNP Costs
The most critical issue in using the SNP optimiser is the appropriate maintenance of the costs. • For example, if storage costs are too high, it may result in no production at all, because supply chain costs exceed the penalties for non-delivery or permanent transport The SNP Costs
The constraints for the optimisation are the demand, the capacities, the material availability and the production and stock transfer horizons. • Most of these constraints are controlled in the optimiser profile as listed in Table 10.3. • The user may define a priority for each demand type. The user may also set priority in the optimiser profile in the “hard prioritisation” checkbox. The SNP Constraints
Discretization is required in the following cases: • Lot-size dependence • Such as decreasing costs due to less set-up or increasing costs if procurement contract are exceeded, • Technical restriction • When it requires different master data, e.g. if the production process or the resource changes for huge lot sizes, • Fixed resource consumption • Such as set-up, • Technical restrictions • When it requires a fixed lot size, a lot size rounding, or a minimum lot size, and • Extension of the standard capacity. The Discrete Optimiser
The use of discretization parameters in each bucket complicates the planning problem, as it is a NP-hard problem in nature. • Try to limit the use of discretization parameters and discrete buckets. • The SNP optimiser makes use of a medium-term plan, to review each discretization step to see if it is really necessary. Discretization for Optimiser
Cost functions are created for procurement, production, and transport and are assigned to the product master (procurement), PDS /PPM (production) and means of transport view of the transportation lane (transport). • Decreasing production costs can be modelled in two ways: one is to assign a cost function to PPM, the other one is to use two PPMs: one with higher cost, and the other one with lower cost but a minimum lot size. Depending on the modeling, the curve for the cost per quantity is different (see Figure 10.5). Discretization for Optimiser
The SNP solution time depends on the number of locations, products and buckets. • To reduce the solution time, the user may aggregate the time buckets – e.g. by decreasing the granularity within the time horizon. • The main issue for SNP optimiser is • To maintain the relevant costs and • To integrate interactive planning steps into scenario (See an example in the SAP implementation). Discretization for the Optimiser
Capable-to-match (CTM) is an APO tool to perform DP/PP interactively • To run CTM, the user needs to prioritize demand elements, categorize supply elements, match demands with the supplies, according to a strategy to search existing stocks, planned receipts, and/or with production. • CTM planning is a first-come, first-serve heuristic; as a result, shortages may occur to late comers. • CTM approach usually applies when demand priorities (e.g. demand type, customer priorities, product priorities) exists Capable-to-Match (CTM)
CTM is a heuristic approach; it does not optimize. • There is no re-planning for the created orders for other demands. • The structure of CTM is shown on the Figure 10.8. • Like the SNP optimizer, the user needs to first set up the CTM planning engine. Capable-to-Match (CTM)
CTM Procedure: • Prioritize demands and orders, and categorize supplies (production and/or stocks), according to the planning mode and the search strategy; • Load the master data and the transaction data (demands and orders) into CTM engine; • Run CTM to match demands with supplies in a location-by-location procedure. • All supply categories and the production are taken into account for each location, according to the search strategy. Capable-to-Match (CTM)
All relevance settings for CTM planning are made within the CTM profile. • CTM profile defines the planning parameters, and triggers CTM planning. • Figure 10.9 outlines the CTM profile. For example, the CTM scope is defined by • the master data selection. • order selection • CTM time stream (e.g., time bucket definition) CTM Profile
Two way to generate the supply categorisation: • Assigning an ATP category (e.g. stock or production order) and/or category groups to each supply category, and • defining limits per location-product and assigning the limits to each supply category (see Figure 10.11). • After the supply limits are defined, the supply categories are assigned to the supply limits in the categorisation profile. • The main purpose of the supply categorisation is to keep the inventory level above a certain limit. CTM Categorization and Search Strategy
The search strategy defines the sequence in which the supplies are matched with demands. • All the planning steps defined in the search strategy – the matching of supplies and the production – are carried out location-by-location. • The sequence of the locations is determined by the priorities (see Figure 10.12), where the location SOURCE1 has a higher priority than SOURCE2, so first all the planning steps are performed for the location SOURCE1. CTM Categorisation and Search Strategy
CTM takes into account, the transportation lane priority, the location priority, and the product priority; and uses them to make decisions as shown in Figure 10.14. • The transportation lane priority is used for sourcing decisions. The location and product priorities become significant when shortage occurs (in which the demand with the highest priority is considered first). CTM Planning
By activating the aggregation selection in CTM profile, all orders can be aggregated to match resources according to the CTM time stream. • Figure 10.16 illustrates the impact of the three aggregation options: • no aggregation, • demand aggregation at the start of CTM time steam, and • demand aggregation at the end of CTM time steam. Aggregation for CTM
There is a parameter in CTM, to specify if we want to transport receipt objects individually or not. • If we want to transport individually, then each supply (e.g. stock, planned order) will be transferred immediately, • Otherwise, the transportation is based on the number of demands. (see Figure 10.19) Integration to ERP
CTM considers the duration for goods issue, transport, and goods receipt to schedule stock transfer orders. • Goods issue and goods receipt are maintained in the product master in days (unit of measurement used), and transport duration is maintained in the transportation lane in hours (unit of measurement used). • Figure 11.3 shows the scheduling for stock transfer orders. Planned Stock Transfers
Capacity consumption of handling resources for goods issue and goods receipt is calculated using handling capacity consumption entries in the product master. • The capacity is represented by handling resources (Resource type “H”) and assigned to the location. • Capacity consumption is calculated as order quantity times capacity consumption for each day of the goods receipt and goods issue time. Handling Capacity
Integrated Distribution & Production Planning SAP Implementation EGN 5623 Enterprise Systems Optimization(Professional MSEM)Fall, 2011
Create Integration Model for Transactional Data in SAP ERP system