Download
1 / 56
560 likes | 580 Views
This article explores the heterogeneity of the HIV epidemic in South Asia, comparing it to the diversity observed in Africa. It examines factors such as concurrent sexual partnerships, male circumcision, and transmission dynamics, highlighting the importance of tailored interventions for different populations.

E N D
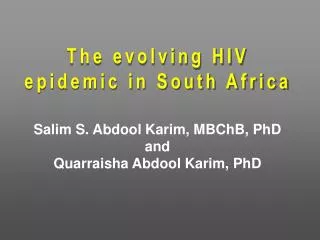
HIV in South Asia: • Understanding and Responding to • a Heterogeneous Epidemic David Wilson The Global HIV/AIDS Program World Bank 28 November, 2005
INTRODUCTION(1-1) • HIV highly heterogeneous • Reached most places at similar time, but spread very differently • Understanding heterogeneity critical – as Africa shows
HETEROGENEITY OF HIV IN AFRICA 0-0.1% Algeria-0.1% Egypt<0.1% 2-3% Mauritania-0.6% Mali-1% 1-5% Eritrea-2.7% Senegal-0.8% Sudan-2.6% Burkina Faso-2% Djibouti-2.9% Nigeria-4% Sierra Leone-1% Ethiopia-4% Ghana-2% Ivory Coast-7% Uganda-7% Congo B-5% Congo DR-5% 4-7% Kenya-7% Tanzania-7% Angola-3% Adult HIV Prevalence Zambia-16% Zimbabwe-20% Madagascar-1% Namibia-20% Botswana-35% 15-35% Swaziland-33% Lesotho-23% Sources: UNAIDS 2004 estimates used unless recent national population-based HIV survey available South Africa-16%
HETEROGENEITY OF HIV:AFRICAN EVIDENCE(1-1) • Given diversity in Africa, what about Asia • Senegal and South Africa aren’t one epidemic – AP and UP aren’t either • India alone has continental epidemic • What causes diversity of HIV in Africa – and implications for South Asia?
HETEROGENEITY OF HIV:CONCURRENT SEXUAL PARTNERSHIPS(1-2) • How does HIV infectiousness vary over disease stages and how do acute infection and structure of sexual partnerships influence transmission? • Sexual partnerships serial – one after another – or concurrent – overlapping
HIV TRANSMISSION RISKS Half of all transmission Wawer et al, 2005
CONCURRENT PARTNERSHIPS GLOBALLY Female Male Percentage of 15-49 year olds reporting > 1 regular partner in last year 60 50 40 30 20 10 0 Singapore Sri Lanka Thailand Philippines Kenya Tanzania Zambia Cote Lesotho D'Ivoire Sources: Cassell et al, 2005 Sources: Halperin et al, 2005
HETEROGENEITY OF HIV:CONCURRENT SEXUAL PARTNERSHIPS(2-2) • Concurrent partnerships less common in Asia • Morris showed that without differences in numbers of partners, HIV transmission 10-fold greater with concurrent partnerships – • Concurrent partnerships explained differences between Uganda and Thailand’s epidemics • South Asia’s epidemics unlikely to be driven by concurrent sexual networks in general population
HETEROGENEITY OF HIV:MALE CIRCUMCISION(1-1) • Meta-analyses - circumcised men 50-70% less likely to get HIV • Ecological studies - male circumcision major factor in variations in Africa’s HIV epidemic • Randomized trial in South Africa - male circumcision reduced HIV transmission by 60+% • In Asia, circumcision’s primary importance ISN’T as intervention, but as determinant of epidemic potential • In highly circumcised countries – Pakistan, Bangladesh and Afghanistan in South Asia and Indonesia and Philippines in East Asia (which have nearly billion people) – heterosexual transmission may be limited (currently below 0.1%) – unless other factors ignite it – which they may
DIVERSITY OF HIV IN ASIA IN 2005 0 Bangladesh 0 Pakistan 0.1 Philippines 0.1 High male circumcision Indonesia (Even lower outside Papua) Fiji Low male circumcision 0.1 China 0.30 Vietnam 0.60 PNG 0.91 India 1.2 Burma Thailand 1.5 2.6 Cambodia 0 1 2 3 Sources: UNAIDS, 2004
HETEROGENEITY OF HIV:THE LETHAL COCKTAIL(1-1) • Concurrent sexual partnerships and limited male circumcision fuel and match that lit Southern Africa’s uniquely explosive epidemics – together, these factors may increase HIV transmission 30-fold – explaining much heterogeneity in HIV epidemic potential
TRANSMISSION DYNAMICS(1-4) • African evidence underscores importance of understanding transmission dynamics • Conventional definition - epidemic concentrated until 1%, then generalized - obscures understanding of HIV transmission patterns • Need revised definition: • Concentrated - transmission largely among vulnerable groups and vulnerable group interventions would reduce overall infection • Generalized - transmission mainly outside vulnerable groups and would continue despite effective vulnerable group interventions
HIV INFECTION IN HIGH PREVALENCEINDIAN STATES 50 44.7 40 40 30 30 25 23.6 22 20 10 4.49 4.49 2.25 1.5 1.43 1.25 1.25 1.25 1.13 0 AP Goa Manipur Mizoram Nagaland Kanartaka Maharashtra ANC IDU SW MSM Sources: India NACO, 2005, US Bureau of the Census, 2005
TRANSMISSION DYNAMICS(2-4) • Asian epidemics driven by vulnerable groups • Asian epidemics further differentiated - ignited by sex or drugs • Asian epidemics ignited by sex if: • Men uncircumcised • Many men routinely visit SW (> 10%) • SW have many clients (> 20 weekly) • Thus, epidemics in Thailand, Cambodia, perhaps Burma, most of India (except North East) ignited by sex
TRANSMISSION DYNAMICS(3-4) • Elsewhere in Asia, IDU the spark plug that ignites sexual transmission, SW the engine that maintains it • Thus, in Pakistan, Bangladesh, Indonesia, Vietnam, China, IDU fires sexual transmission • Philippines – no spark plug, little transmission? • East Asian data shows how IDU can fuel HIV in sex work, fundamentally amplifying epidemic potential • Pakistan, Bangladesh, Afghanistan – lands of opportunity. Effective IDU programs can dramatically curtail sexual epidemics
120,000 108,296 48 48 100,000 80,000 60,000 HIV prevalence 40,000 16 35,850 20,000 2,049 0 0 1986 1987 1988 1989 1990 1991 1992 1993 1994 1995 1996 1997 1998 1999 2000 2001 2002 2003 2004 2005 2006 2007 2008 2009 2010 1985 IDU IGNITING DORMANT EPIDEMICIN JAKARTA, INDONESIA Sexual infections originating from IDU 60 50 40 41 30 Cumulative HIV infections 20 10 HIV infections in IDU if nothing changes HIV infections if nothing changes HIV infections without IDU epidemic IDU HIV prevalence Sources: Pisani, 2005
MANY IDU IN SOUTH ASIA BUY UNPROTECTED SEX Sources: MAP, 2004, NACP, 2005, NACO, 2005
TRANSMISSION DYNAMICS(4-4) • Concentrated epidemics important • Given size of Asia’s IDU and SW populations, we will have large, important, concentrated epidemics
USING DATA FOR PROGRAMMING:OVERVIEW(1-1) • India and Nepal - some infection in general population and high rates in SW and IDU • Pakistan and Bangladesh – little HIV in general population, SW or MSM and higher rates in IDU • Sri Lanka – little HIV in any groups
USING DATA FOR PROGRAMMING:DATA ROBUSTNESS(1-1) • India relies on ANC data - data emerging from other sources • Possible upward bias of higher prevalence mainly urban sites counteracted by downward bias of lower prevalence female rates • India’s ANC and vulnerable group data considerable but uneven, especially in North • Nepal – data limited, especially for general population • Bangladesh and recently Pakistan - high quality bio-behavioral surveillance of vulnerable groups
ANC AND POPULATION DATA IN TAMIL NADU 1.2 1 0.8 0.6 0.4 0.2 0 TN POP 2004 1999 ANC 2002 ANC 1998 ANC 2000 ANC 2001 ANC 2003 ANC 2004 ANC CHENNAI POP 2003 Sources: NACO, 2005, APAC, 2005, Celentano et al, 2004
USING DATA FOR PROGRAMMING:INDIA(1-5) • India’s 7 high prevalence states – in South, West and North-East - have 30% of population and 70% of HIV cases • Battleground states NL MN MZ MH AP GA KN TN Sources: NACO, 2005
USING DATA FOR PROGRAMMING:INDIA(2-5) • HIV in South, West and North-East five-fold higher than rest of India Sources: Kumar et al, 2005
USING DATA FOR PROGRAMMING:INDIA(3-5) • Two to four-fold more sexual partners in last year in South and West MALES FEMALES Sources: Kumar et al, 2005
USING DATA FOR PROGRAMMING:INDIA(4-5) • District analysis critical • About 50 high prevalence districts (many rural) – have 10% of national population and about 50% of HIV • Many high prevalence districts in 3 major clusters: • KN-MH corridor • Coastal AP • North-East NE KN-MH Coastal AP Sources: NACO, 2005 Sources: NACO, 2005
USING DATA FOR PROGRAMMING:INDIA(5-5) Summary • India’s epidemic containable - as TN shows • Ignited by IDU in North-West and SW elsewhere • Requires highly disaggregated analysis and response – focusing on high prevalence districts and blocks • Likely to be determined in 30-50 key districts in 7 key states
USING DATA FOR PROGRAMMING:NEPAL(1-3) • In Kathmandu, IDU rates rose rapidly, amplifying SW infection Sources: NACO, 2005
USING DATA FOR PROGRAMMING:NEPAL(2-3) • Migration, especially to Mumbai, amplifies HIV infection - 40% of Nepal’s epidemic linked to migration to India HIV INFECTION AMONG SW 71% 40% 16% Sources: NCASC, FHI, 2003
USING DATA FOR PROGRAMMING:NEPAL(3-3) Summary • Nepal’s epidemic comparable to India’s and more severe than recognized • Driven by IDU and SW and migrants, particularly SW migrating to Mumbai • Instability hinders response - innovative partnerships vital
USING DATA FOR PROGRAMMING:PAKISTAN(1-2) • Epidemic largely in Karachi - mainly IDU, also MSM. FSW rates close to zero Sources: NACP, 2004,20055
USING DATA FOR PROGRAMMING:PAKISTAN(2-2) Summary • Molecular epidemiology shows HIV strains in Karachi new – rising fast • Pakistan today – lessons from Indonesia a decade ago • Without immediate large-scale, IDU and SW programs, HIV injected into previously resilient, low-prevalence female and male SW networks, fundamentally transforming epidemic character and potential
USING DATA FOR PROGRAMMING:AFGHANISTAN(1-1) • Between Iran, Central Asia and Pakistan – IDU rates rising 13% <2000 2005
6 5 4.9 4 4 4 3 1.7 2 2 1.4 1 0.6 0 0 0 Round II Round III Round IV Round V Round VI Central SE D NW F1 USING DATA FOR PROGRAMMING:BANGLADESH(1-5) • HIV rising among IDU, especially in Central region Sources: NACP, 2004,20055
USING DATA FOR PROGRAMMING:BANGLADESH(2-5) • Remarkable concentration – and heterogeneity 10 8.9 8 6 4 4 2 1.4 0 Round IV Round V Round VI Sources: NASP, 2004,20055
USING DATA FOR PROGRAMMING:BANGLADESH(3-5) • Rates among other groups almost zero 5 4 3 2 0.6 1 0.4 0.4 0.2 0.01 0 0 0 SW HIJRA MSM Central SE NE NW Sources: NASP, 2004,2005
USING DATA FOR PROGRAMMING:BANGLADESH(4-5) • But rates won’t stay zero unless injecting is kept safe 10 70 FEMALE IDU HIV AMONG FEMALE IDU 9 60 7.1 8 50 7 4.9 6 40 5 30 4 20 3 1.3 2 10 0 1 0 0 Male IDU Female IDU % sex % main Clients per worker income sex month Central A1 Central A2 Central A work Sources: NASP, 2004,2005
USING DATA FOR PROGRAMMING:BANGLADESH (5-5) Summary • Epidemic highly focused among IDU in defined localities • Ultra-intensive focus on these areas and large-scale national IDU, SW and MSM programs can prevent further transmission • Some programs already slowing HIV transmission?
USING DATA FOR PROGRAMMING:SRI LANKA(1-1) Summary • Sri Lanka’s epidemic contingent on likelihood of transition to IDU • Priorities: • Establish early warning system to detect growth in IDU • Build capacity to manage opiate addiction now • And keep SW safe
RECOMMENDATIONS:HIV IN SOUTH ASIA CAN BE CONTAINED(1-1) • South Asia’s HIV epidemics can be curbed • Have sufficient knowledge to tackle South Asia’s epidemics - challenge is to sharpen focus and strengthen implementation
ENCOURAGING TRENDS IN TAMIL NADU AND KOLKOTA 18 100 16.8 16.3 16 14.7 80 14 12.6 12 60 10.4 10 9.02 8 40 6 4 4 2.4 20 2.4 2 0.75 1.13 1 1 1 0.88 0 0 0 1998 1999 2000 2001 2002 2003 1992 1994 1998 2004 ANC MSM STI Unprotected sex HIV Sources: NACO, 2005, UNAIDS, 2005
RECOMMENDATIONS:TWO-PRONGED APPROACH(1-1) • Need two pronged approach • First, implementing high quality, high coverage programs for major vulnerable groups • Second, reducing stigma and addressing underlying structural determinants of epidemic
RECOMMENDATIONS:FOCUS(1-3) • Vital to understand heterogeneity of HIV and to focus – dissipation of focus major limitation of HIV programs • Geographic foci include 30-50 highest prevalence districts in India’s seven highest prevalence states, Karachi in Pakistan and two neighborhoods in Bangladesh where over half of HIV+ IDU found
MSM 25 SK 26 Other 56 Migrant 249 Prison 56 IDU 74 SW 209 RECOMMENDATIONS:FOCUS(2-3) • Thematic focus equally important • NACO supports more interventions for Indian migrants than SW - yet migrants have far lower HIV rates and far fewer partners • Far too few MSM interventions Sources: NACO, 2005
RECOMMENDATIONS:FOCUS (3-3) • Bangladesh has many sexual health programs for high risk men – how high risk? 10 9 8 7 6 5 4 3 2 1 0.4 0.6 0.3 0.3 0.2 0.2 0 Round I Round II Round III Round IV Round V Round VI Sources: NACO, 2005
6 4 +5.9 2 0 -2 -5.8 -4 -6 29 CITIES WITH NEEDLE PROGRAMS 52 CITIES WITHOUT NEEDLE PROGRAMS RECOMMENDATIONS:GREATER FOCUS ON IDU(1-2) • Global HIV analysis largely influenced by sexual frameworks - greater emphasis on IDU required • Significant political opposition to harm reduction - despite compelling evidence IDU RECEIVING AND NOT RECEIVING METHADONE CITIES WITH AND WITHOUT NEEDLE PROGRAMS 22% 25 20 Change in HIV prevalence 15 HIV incidence 10 3.5% 5 0 NO METHADONE METHADONE Sources: Hurley et al, 2005, Metzger et al, 1993
ENCOURAGING TRENDS IN TAMIL NADU – EXCEPT AMONG IDU 50 40 39.11 33.8 30 26.7 24.56 20 16.8 12.6 16.3 14.7 10.4 10 9.02 4 2.4 2.4 0.75 0 0 1 1 1 1.13 0.88 1998 1999 2000 2001 2002 2003 IDU STI MSM ANC Sources: NACO, 2005
RECOMMENDATIONSGREATER FOCUS ON IDU(2-2) • Epidemic potential in Pakistan, Bangladesh, Afghanistan hugely influenced by effectiveness of IDU programs today