Download
1 / 16
160 likes | 259 Views
Stay informed with this comprehensive update on natural gas prices, demand, supply, and pipelines serving California. Explore data on LNG imports, Lower 48 states shale production, and domestic shale production trends. Learn about major production basins, key pipelines, and the growth of unconventional shale supply. Prepared by the California Energy Commission in 2008.

E N D
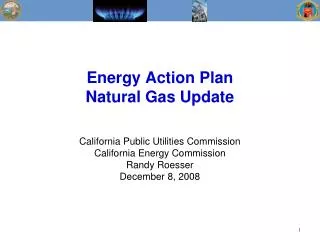
Energy Action PlanNatural Gas Update California Public Utilities Commission California Energy Commission Randy Roesser December 8, 2008
Henry Hub Daily Spot Prices $13.31 July 2
CA Natural Gas Spot Prices $12.82 Jun 30
U.S. Natural Gas Demand Source: EIA November 2008 STEO
U.S. Natural Gas Supply Source: EIA November 2008 STEO
Western Canadian Sedimentary Basin 6 Kingsgate Coleman 1 5 5 Stanfield 5 9 Malin 5 Rocky Mountain Basin 13 7 3 8 San Juan Basin 5 14 4 2 Anadarko Basin Topock 10 11 12 2 2 Blythe Permian Basin Major Production Basins ServingWestern US, Canada and California • 1 ANG • 2 El Paso • 3 Kern River • 4 Mojave • 5 Northwest • 6 NOVA • 7 Paiute • 8 PG&E • 9 PG&E GT-NW • 10 SoCalGas • 11 SDG&E • 12 Transwestern • 13 Tuscarora • 14 Southern Trails California Energy Commission Staff, 2007
Proposed Natural Gas PipelinesRocky Mountains To West Coast • Kern River: 0.2 to 1.0 bcf/d expansion of existing 1,650 mile 1.7 bcf/d pipeline from Wyoming to Southern California. In-service date: late 2010 • Ruby Pipeline: 680 mile, 1.2 bcf/d capacity line from Opal, Wyoming to Malin, Oregon. In-service date: early 2011 • Sunstone Pipeline: 585 mile, 1.2 bcf/d capacity line from Opal, Wyoming to Stanfield, Oregon. In-service date: late 2011
World LNG Estimated November 2008 Prices UK $ 12.60 Belgium $ 12.50 Cove Point $ 6.51 Spain $ 13.10 Korea $ 13.00 Japan $ 13.00 Lake Charles $ 5.63 Altamira $ 6.46 India $ 13.00 Prepared by CEC Staff Nov 2008
Lower 48 States Shale Production 1st Quarter 2008 Average - MMcf/d Bakken Shale 69 Antrim Shale 356 Baxter Shale 14 Marcellus Shale N/A Pierre Shale 1 Fayetteville Shale 496 Woodford Shale 180 New Albany Shale N/A Huron Shale N/A Barnett Shale 3,935 Haynesville Shale 58 1st Quarter 2008 Total Lower 48 Shale: 5,109 MMcf/d (33% increase over 2007 production) Source: Lippman Consulting, Inc.
Domestic Shale Production • Shale fastest growing unconventional supply • Over 20 shale basins have been identified in the US • 6 shale basins currently producing • Unconventional production up 65% over the past decade – 1998: 5.4 tcf (14.8 bcf/d) or 28% of total NG production 2007: 8.9 tcf (24.4 bcf/d) or 46% of total NG production • Recent EIA shale production forecasts have significantly underestimated actual production