Download
1 / 1
10 likes | 135 Views
Continuous Light Absorption Photometer (CLAP) Performance J.Ogren , J.Wendell , P.Sheridan , D. Hageman and A . Jefferson. CLAP Design. Instrument Calibrations Measured LED spectral output.

E N D
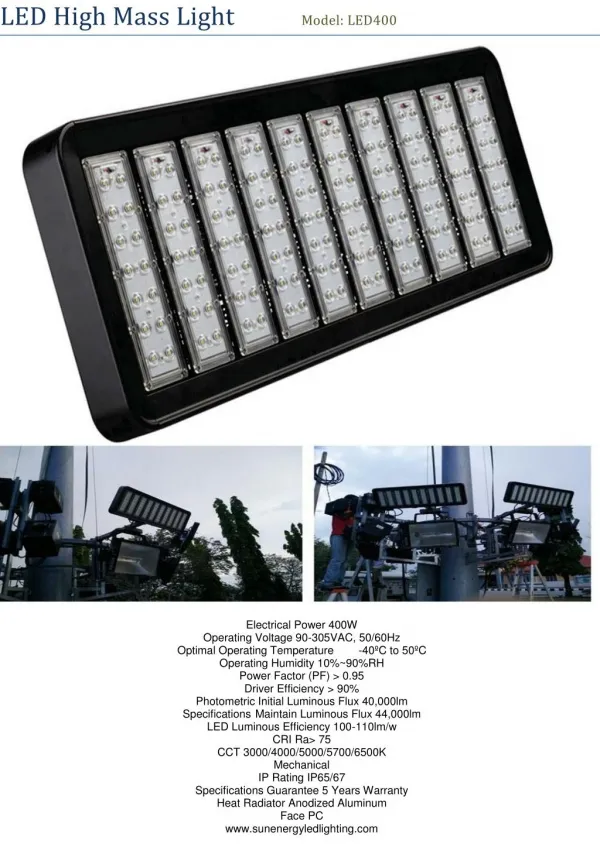
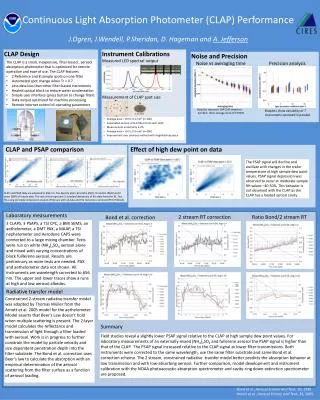
Continuous Light Absorption Photometer (CLAP) Performance J.Ogren, J.Wendell, P.Sheridan, D. Hageman and A. Jefferson CLAP Design Instrument Calibrations Measured LED spectral output • The CLAP is a small, inexpensive, filter-based , aerosol absorption photometer that is optimized for remote operation and ease of use. The CLAP features • 2 Reference and 8 sample spots on one filter • Automated spot change when Tr < 0.7 • Less data loss than other filter-based instruments • Heated optical block to reduce water condensation • Simple user interface (press button to change filter) • Data output optimized for machine processing • Remote internet control of operating parameters Noise and Precision Noise vs averaging time Precision analysis Measurement of CLAP spot size Boxplots represent 194 CLAP detectors. Symbols show average noise of 6 PSAPs. Boxplots show variability of 7 instruments operated in parallel. • Average area = 19.9 ± 0.5 mm2 (n=200) • Automated analysis of test filters from each CLAP • Measurement uncertainty is 2% • Average area = 19.9 ± 0.5 mm2 (n=200) • Improvement over previous method with magnified eye piece Effect of high dew point on data CLAP and PSAP comparison CLAP and PSAP data are adjusted to 550 nm. The density plots 6months (PVC), 9 months (PGH) and 2 years (SGP) of hourly data. The red circles represent 3 standard deviations of the data from the fit. Two fits using principle component analysis (PCA) are with all data and the red circles removed (PCA Filtered). The PSAP signal will decline and oscillate with changes in the trailer temperature at high sample dew point values. PSAP signal depression was observed to occur at moderate sample RH values ~40-50%. This behavior is not observed with the CLAP as the CLAP has a heated optical cavity. Laboratory measurements 2 stream RT correction Ratio Bond/2 stream RT Bond et al. correction 3 CLAPS, 3 PSAPS, a TSI CPC, a BMI SEMS, an aethelometer, a DMT PAX, a MAAP, a TSI nephelometer and Aerodyne CAPS were connected to a large mixing chamber. Tests were run on white (NH4)2SO4 aerosol alone and mixed with varying concentrations of black fulllerene aerosol. Results are preliminary as more tests are needed. PAX and aethelometer data not shown. All instruments are wavelength corrected to 656 nm. The upper and lower traces show a runs at high and low aerosol albedos. Radiative transfer model Constrained 2-stream radiative transfer model was adapted by Thomas Müller from the Arnott et al. 2005 model for the aethelometer. Model asserts that Beer’s Law doesn’t hold when multiple scattering is present. The 2-layer model calculates the reflectance and transmission of light through a filter loaded with aerosol. Work is in progress to further constrain the model by particle velocity and size dependent penetration depth into the filter substrate. The Bond et al. correction uses Beer’s law to calculate the absorption with an empirical determination of the aerosol scattering from the filter surface as a function of aerosol loading. Summary Field studies reveal a slightly lower PSAP signal relative to the CLAP at high sample dew point values. For laboratory measurements of an externally-mixed (NH4)2SO4and fullerene aerosol the PSAP signal is higher than that of the CLAP. The PSAP signal increased relative to the CLAP signal at lower filter transmissions. Both instruments were corrected to the same wavelength, use the same filter substrate and same Bond et al. correction scheme. The 2 stream, constrained radiative transfer model better predicts the absorption behavior at low transmission and with low-absorbing aerosol. Further comparison, model development and instrument calibration with the NOAA photoacoustic absorption spectrometer and cavity-ring down extinction spectrometer are proposed. Bond et al., Aerosol Science and Tech, 30, 1999 Arnott et al., Aerosol Science and Tech, 39, 2005.