Download
1 / 54
540 likes | 575 Views
The Atlas of the Lagoon of Venice. From a book to a dynamic Web GIS. Alessandro Mulazzani. Municipality of Venice Marine Science Institute of the National Research Council (ISMAR -CNR ). Summary of this presentation. History of the Atlas of the Lagoon

E N D
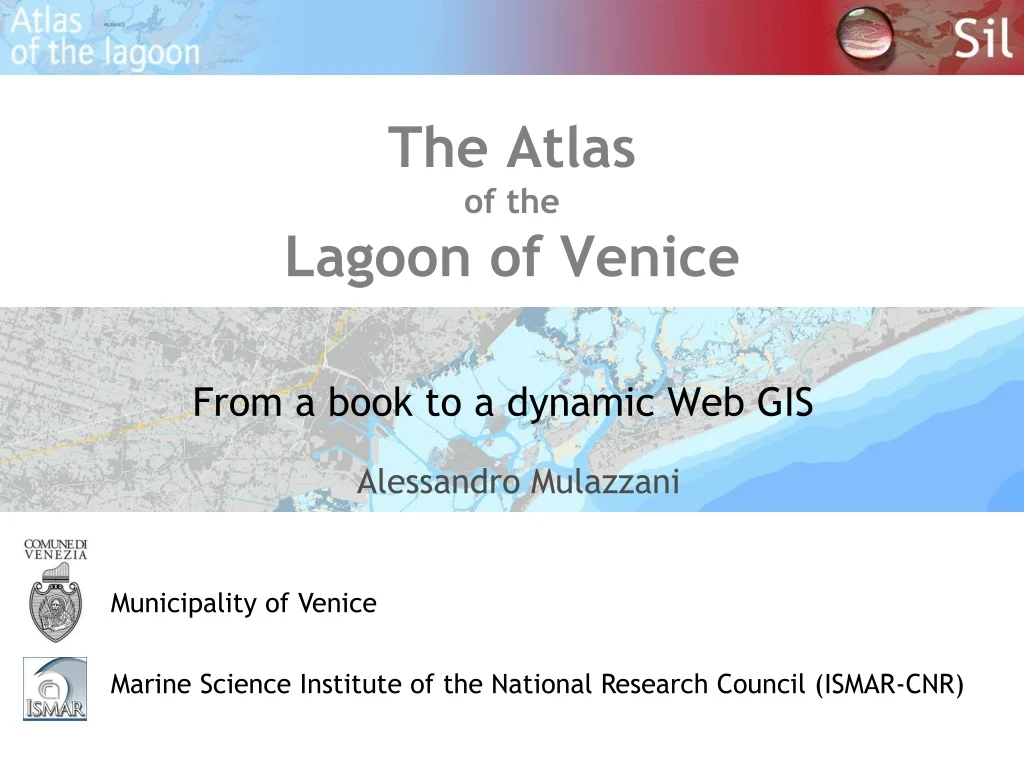
The Atlasof theLagoon of Venice From a book to a dynamic Web GIS Alessandro Mulazzani Municipality of Venice Marine Science Institute of the National Research Council (ISMAR-CNR)
Summary of this presentation • History of the Atlas of the Lagoon • From the book to the first Atlas Web GIS • SIL-Lagoon Information System: the Atlas today • Interoperability • Strengths, Weaknesses, Opportunities & Threats • Perspectives for the future
History of the Atlas of the Lagoon • 2002 the Natural Observatory of the Lagoon has been created, also with the aim to produce the Atlas of the lagoon of Venice • 2003-2005: production of the Atlas of the lagoon (book) • 2006: the Atlas is online (English version in 2009) • 2007-2009: development of the prototype of the Lagoon Information System (or “SIL”), online since September 2009
The objectives • to bring together and organise the knowledge held by separate research bodies, so that both citizens and various institutions could refer to a single, shared information base • to provide a visual knowledge tool, accessible for both professionals (technicians and administrators) and the general population
The team • Several researchers and technicians, by means of agreements between institutions • operating in the city of Venice: Italian Council for Research - Institute of Marine Sciences, IUAV and Ca’ Foscari University, Veneto Institute of Sciences, Letters and Arts • and beyond: Technische Universität, Berlin, Worcester Polytechnic Institute, Boston • and thanks to material provided by the Venice Water Management Authority, Venice provincial authorities, ARPAV (Veneto Regional Environmental Protection Agency), the Venice Museum of Natural History and other institutions
Italian Council for Research Institute of Marine Sciences CNR-ISMAR Venice Water Management Authority (Magistrato alle Acque di Venezia) Collaborators Research bodies, Universities and ot he independent institutions Public Administrations Ca' Foscari University Veneto Regional Environmental Protection Agency City of VeniceOsservatorio Nat. Laguna Venice Museum of Natural History Tides forecast centre IUAV University TU Berlin Province of Venezia IVSLA
Geographical coverage of the Atlas The ecosystem approach (rather than administrative) has been applied to define the Atlas geographical coverage: • the Lagoon of Venice • its catchment area • its coastal area
Contents of the Atlas 103 plates grouped in five main thematic sections: • Geosphere (climate, geology and geomorphology, water) • Biosphere (animals, plants) • Anthroposphere (pollution, territorial transformation) • ProtectedEnvironments (social dynamics, administrative controls) • Integrated Analyses (combinations of themes, and relations between them)
GEOSPHERE Climate 5 Geology 11 Hydrology 18 BIOSPHERE Fauna 19 Flora 16 ANTHROPOSPHERE Pollution 10 Territorial transformation 2 PROTECTED ENVIRONMENTS Social dynamics 1 Administrative controls 6 INTEGRATED ANALYSES 15 Total PLATES 103
First Atlas Web GIS (year 2006) • It contains exactly the same information as the book (text and plates), plus the possibility to: • zoom and pan • perform queries in some maps • measure lengths • print and download maps (also geoTiff) • Since 2009 the Atlas is available also in English
First Atlas Web GIS • Entirely Open Source platform: • MapServer • Pmapper • No metadata catalogue to search
SIL-Lagoon Information System: the future of the Atlas SIL prototype is the evolution of the Atlas: • allows overlapping between several data levels • supports transparency adjustment • may allow to download the original data (for ex. a shapefile) • makes use of Web Map Service protocol • is updated by the data producers • foresees continuous collaboration of project partners (data providers)
SIL: Platform • Content Management System: Drupal • Cartographic engine: MAPSERVER • Server programming languages: PHP/MapScript • Client technology: html, javascript/ajax • Web-GIS: p.mapper (ver. 3.2 so far, 4 in future ) • Database: PostgreSQL with PostGIS • WMS server: Mapserver / Geoserver • Metadata catalogue: GeoNetwork – still to be implemented
Partners of SIL • SIL is based on an official collaboration (not founded) between the City of Venice and the ISMAR-CNR • October 2009: the City of Venice joined the Cartographic Cooperating System (SCC) of The National Cartographic Portal, to exchange data via WMS
Metadata and metadata catalogue • A metadata catalogue is foreseen, using GeoNetwork • So far, “pseudo-metadata” are temporarily associated to each data level
“pseudo-metada” Title
“pseudo-metada” Data owner/provider
“pseudo-metada” Sampling
“pseudo-metada” Data processing
“pseudo-metada” Data description
“pseudo-metada” Attachements (e.g., Text, pictures, downloadable data, etc.)
Interoperability:some examples • WMS with the Institute of Marine Sciences -CNR Link -> • WMS with Portale Cartografico Nazionale example protected area map -> example base maps -> • Link to EUNIS habitat database example ->
SWOT: Strength, Weakness, Opportunities & Threats the objective: develop a portal with updated and comprehensive environmental data on the Lagoon of Venice, coming from all the data producers the organization (present): Natural observatory for the Lagoon (City of Venice)
Strength • Public administration-Research Institute partnership • Project partners open to publish own data • Ecosystem approach • Open source software • Possibility to download data • Powerful user management
Weakness • Local and trans-institutional portal • Absence of internal coordination for spatial data management • Unsteady financing and consequent slow development • Metadata catalogue to be completed