1 / 9

Pie charts (AKA, circle charts) are fairly good ways of roughly describing qualitative data.

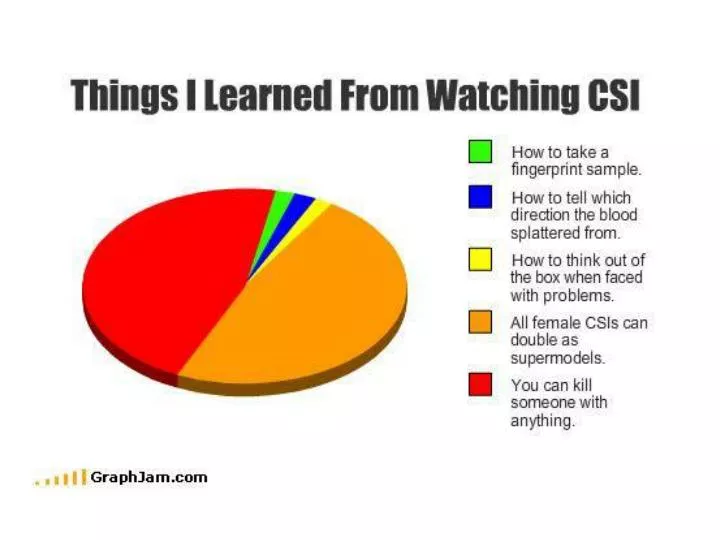
Pie charts (AKA, circle charts) are fairly good ways of roughly describing qualitative data. . Why only “fairly” ?. What could be better ?. Why is this relative frequency bar chart better than a pie chart?. Chuck – A – Luck!

kermit
Download Presentation

Pie charts (AKA, circle charts) are fairly good ways of roughly describing qualitative data.

An Image/Link below is provided (as is) to download presentation Download Policy: Content on the Website is provided to you AS IS for your information and personal use and may not be sold / licensed / shared on other websites without getting consent from its author. Content is provided to you AS IS for your information and personal use only. Download presentation by click this link. While downloading, if for some reason you are not able to download a presentation, the publisher may have deleted the file from their server. During download, if you can't get a presentation, the file might be deleted by the publisher.

E N D

Presentation Transcript


  1. Pie charts (AKA, circle charts) are fairly good ways of roughly describing qualitative data. Why only “fairly” ? What could be better?

  2. Why is this relative frequency bar chart better than a pie chart?

  3. Chuck – A – Luck! • Place your money (“ante”)…we’ll say $1”… on one of the 6 pip numbers (eh?) • Roll the “nest” (contains 3 fair dice). • You win (in varying amounts) if one or more of your number come up.

More Related