Creating Professional Posters
Creating Professional Posters. Audrey Rorrer , PhD Research Associate UNC Charlotte. Characteristics of Quality Posters. Clearly & effectively communicates research results Concise, succinct, direct Addresses the specific audience Anticipate their knowledge level

Creating Professional Posters
E N D
Presentation Transcript
Creating Professional Posters Audrey Rorrer , PhD Research Associate UNC Charlotte
Characteristics of Quality Posters • Clearly & effectively communicates research results • Concise, succinct, direct • Addresses the specific audience • Anticipate their knowledge level • Encourages discussion & interaction • Use inviting graphs, charts, pictures
Poster Components • Abstract • Statement of purpose • Results • Conclusions Presented Verbally to your Audience at the Celebration in 5-10 minutes
Poster Components • Abstract • Overall summary paragraph of the project • Statement of Purpose • The research problem and question, including a few key literature citations in support of your argument or hypothesis • Or- The component of your SLC that is being formatively discussed • Results • The data results, findings, outcomes, etc. as applicable to your project • Conclusions • What was gained, discovered, learned, recommendations or tips, etc. as applicable to your project
Design Elements • Maximize ink: use color and contrast • Color palette of 5 or fewer colors • Up to 2 font types • Visuals: use graphs, charts, pictures • Images are more powerful than words • stop
Examples These are from Summer Research Experiences for Undergraduate student projects at UNC Charlotte, and from UNC Charlotte STARS These are intended as examples, NOT templates All were done in power point
EleMental: The Recurrence Katelyn Doran, kedoran@uncc.edu Amanda Chaffin, katla@wulfkub.com Advisor: Tiffany Barnes, tbarnes2@uncc.edu University of North Carolina at Charlotte Overview: EleMental the Recurrence is a single-player, three-dimensional game in which students have to program to complete challenges. The goal is to help students understand of the concept of recursion. Contributions: Use of a working compiler in-game eliminates the need for multiple choice questions. The game also makes use of 3D graphics, which is a change from previous Game2Learn projects. There is also a unique terrain modification feature within the game engine which is an excellent tool for instruction on data structures. Each of these items helps to create a better visual for the inner workings of recursive code. Project: EleMental was designed to help students visualize recursion, one of the more challenging computer science subjects to grasp. The game is built upon a student-created engine using the C# language and Microsoft’s XNA Framework. Development started on the project in June 2008. The stack image is intended to help students understand how recursion works in the background while a program runs. The compiler, on the left, accepts student code then compiles and runs it. The student-entered code can actually alter the game-play. Motivation: Recursion is one of the most challenging computer science topics for students to understand. The main issue stems from the difficulty students have visualizing the way recursion works. The hope is that by creating a visual of the flow of a recursive algorithm, specifically Depth First Search, students will have a better understanding of the material and will be more likely to remain in the Computer Science program. Game Play: At the start of each level players are presented with a coding challenge to complete. Each challenge has the players filling in areas of actual code. Players then get to compile and run their code to progress through the world. Players walk through a binary tree structure following the principles of depth-first search. Lessons Learned: Design: Keep the educational content as the focus by being aware of which concept is being taught and knowing the best way to implement it with the tools available. Architecture: Carefully plan the interactions between game and educational components. For EleMental, a new event manager system had to be created to pass messages between the game and educational activities. Study: Ensure that the study will provide conclusive results by pinpointing the target audience and designing the study so it accurately tests participant knowledge. Depth First Search : Future Work: To complete the current study on EleMental. To assist in the upcoming crossover study comparing EleMental to other educational games. To create another game teaching recursion based on my knowledge from this project as well as my experience in UNC Charlotte’s Design and Analysis of Algorithms Course The game-play for EleMental takes place in a 3D environment which represents a binary tree, a common data structure in computer science. This tree is traversed in-game using Depth-First Search. Students receive visual feedback throughout the game. Including feedback whenever they have entered code incorrectly. Study: There is a study in progress for EleMental. Participants complete a pre-test before playing the game and then complete a post-test after completion of game play. Participants also complete a survey based on their opinion of the game. Results look promising as most participants feel the game is an effective educational tool. References: Barnes, T., Richter, H., et al. (2007). Game2Learn: A study of games as tools for learning introductory programming. Submitted to SIGCSE2007, Kentucky, USA, Mar. 2007. Maja Pivec. Editorial: Play and learn: potentials of game-based learning. British Journal of Educational Technology, Volume 38, Issue 3, Page 387-393, May 2007, doi: 10.1111/j.1467- 8535.2007.00722.x Moser, Robert. A fantasy adventure game as a learning environment: Why learning to program is so difficult and what can be done about it. Uppsala, Sweden. ACM, 1997. Rabin, Steve. Ed. Introduction to Game Development. 1st ed. Charles River Media, 2005. Nick Yee. CyberPsychology & Behavior. December 1, 2006, 9(6): 772-775. doi:10.1089/cpb.2006.9.772. Steiner, B., Kaplan, N., and Moulthrop, S. 2006. When play works: turning game-playing into learning. In Proceedings of the 2006 Conference on interaction Design and Children (Tampere, Finland, June 07 - 09, 2006). IDC '06. ACM, New York, NY, 137-140. DOI= http://doi.acm.org/10.1145/1139073.1139107 Recursion & Stacks: As recursive calls are made, the calls are stored in a stack, a CS data structure, until the correct value is returned to them. The stack to the right is the stack illustration used in-game.
LIDAR-based Change Detection of North Carolina Coastal AreasDr. Zachary Wartell/Thomas Butkiewicz Timothy Scott Setup: The LIDAR data is downloaded from either NOAA’s website or other online repositories. The LIDAR data is preprocessed and chunked into a custom file format (.lps) that is highly efficient. Dividing the sample points into rectangular units based on their location makes it easier to catalog and process during change detection. The chunked files are then triangulated to form 3D mesh representations. These meshes are then simplified to multiple levels-of-detail, while preserving boundary edges, as maintaining the coastline’s accuracy is an important consideration. The 3D meshes and geospatial vector data such as the state’s outline is loaded into our interactive viewer which allows the user to freely explore the overall collection. Abstract: The long term goal of this project is to discover a robust method of using historical remote sensing data to accurately trace coastal changes along North Carolina's coast over the last decade. By understanding the previous changes, those who study coastal regions can better predict future changes due to hurricanes, etc. As a first step towards this goal, one must make sense of the overwhelming amount of historical data available to answer the important questions of where and when do we possess sufficient overlapping sampling and across what time periods to make meaningful comparisons. This project seeks to address this issue by providing tools to both catalog available historical data, and allow a visual exploration of the generated catalog to identify promising overlapping survey extents. • Results: • The newer file format for representing LIDAR data, LAS, can be now be loaded and processed. • All encountered data formats can now be converted to a single standard. • A new boundary-edge preserving simplification algorithm allows for dramatically smaller meshes while still showing detail along the coastline. • All of the LIDAR datasets from NOAA can be interactively viewed superimposed along a high resolution vector representation of North Carolina’s coastal border. Figure 1: Original, unprocessed LIDAR data Introduction: Light Detection and Ranging (LIDAR) is a remote sensing technology that uses laser rangefinders to map the distances to remote surfaces. By combining these rangefinders with GPS systems on an airborne platform, large swaths of terrain can be accurately sampled at high resolutions. The resulting data is then traditionally used to generate topographic maps at high resolutions and derive other geospatial datasets. NOAA has collected the datasets from LIDAR surveys along North Carolina’s coastline spanning over a decade. By developing a method of detecting changes between and across these historical datasets, we can identify and extract the terrain features that have changed over time. These changes can then be related to major events such as hurricanes to identify the event’s effects on the coastline. This collection, however, is both tremendously large in terms of overall size and also ambiguous as to the formats, coordinate systems, and extents of the individual datasets contained within. We have developed a set of tools that convert the datasets to a standard format, extract iconic meshes to form a manageable catalog, and finally provide an interactive environment for the exploration of the entire collection. This allows future developers to quickly identify what areas have overlapping samplings across multiple time steps, and are thus excellent candidates to focus on for change detection. Figure 4: Triangulation of LIDAR data Conclusion: We have created tools that form a pipeline that begins with a massive and disorganized collection of historical LIDAR datasets and ends with a standardized catalog of lightweight 3D meshes. Our interactive exploration tool then presents this catalog to the user in a intuitive map-based environment. Through this experience, I have learned how to work in the Visual Studio environment, the basics of graphics programming using OpenGL in C++, explored mesh simplification, and had lots of experience debugging code. Figure 3: 3D processed LIDAR data with water and land shaded different colors • Future Work: • Explore methods to reassemble the square simplified meshes into a single mesh for each entire dataset, with minimal detail in the center, but a highly preserved coastline. • More datasets to be processed through the pipeline and loaded into the LIDAR viewer in order to show the entire coastal area of North Carolina. • Change detection to produce viewable 3D models of differences between multiple overlapping LIDAR datasets. • Ability to show these changes over time in a coherent manner. • Research: • LAS File Format • Integrate the libLas library into existing LIDAR point processing software. • Determine how to efficiently convert from multiple data formats and coordinate systems into a standard custom format. • New data sets • Modify existing processing algorithms to generate new levels-of-detail while also preserving the boundary edges (coastline). • Create an interactive application to allow exploration of multiple datasets. Figure 2: Chunks of LIDAR data with different colors Acknowledgements: University of North Carolina at Charlotte Dr. Zachary Wartell Thomas Butkiewicz Visualization Lab
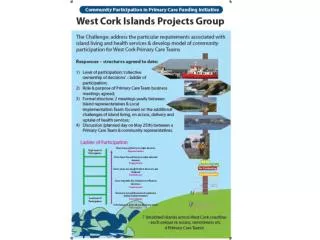
STARS Leadership Corps – Tiered participation of students, professionals and educators in research and civic engagement catalyzes regional partnerships. Leadership Projects are new and existing regional programs for broadening participation. The SLC puts a common wrapper around disparate programs in diverse institutions. SLC Model - STARS Central Values (outer ring) are advanced by SLC activities (middle ring) to produce outcomes (inner ring) as measured by leading (bottom) and lagging (top) indicators. Research Universities Minority Institutions Women’s Institutions K-12 Partners Industry Partners STUDENTS Community Colleges Community Partners Professional Organizations Scaling the STARS Alliance: A National Community for Broadening Participation through Regional Partnerships PIs -Teresa Dahlberg, Tiffany Barnes, Heather Lipford; Project Director – Karen Bean UNC Charlotte, Teresa.Dahlberg@uncc.edu, Tiffany.Barnes@uncc.edu, Heather.Lipford@uncc.edu, Karen.Bean@uncc.edu STARS Online Online social networking & community of practice Go to www.starsalliance.org to join the 31 School Groups, 21 Affinity Groups, & individual members Digital library collection of SLC practices and assessment Go to www.bpcportal.org to search & share STARS practices The STARS Alliance Regional Partnership Model STARS Leadership Corps (SLC) is . . . STARS Celebration • STARS Celebrations are annual conferences that build capacity by providing training and development for students, faculty and partners • 6 Celebrations have included 1,357 attendees • 17 new & 14 returning institutions in 2011 • Outcomes include networking, leadership development and team building CORPS The STARS Scaling Vision for 2016 • A national call to action…”to recruit, develop and become the next generation of computing professionals” • Implemented as a repeatable annual program that begins with the national STARS Celebrationand continues with Leadership Projectsundertaken with regional partners • Institutionalized through multi-year Curricular and co-curricular structures • 50 STARS colleges and universities will institutionalize the STARS Leadership Corps as a multi-year curricular and co-curricular program • We have 31 members in 2011-12 • The STARS Celebration will be a national Student Leadership Conference and forum for fostering regional engagement for BPC • STARS Demonstration Projects will be nationally adopted, including new Tiered Research Experiences for Undergraduates • The STARS Institute nonprofit will sustain the annual STARS Celebration and Community STARS Values • Technical Excellence – competence leads to confidence and increases interest in computing • Leadership – soft skills, leadership, team work, writing, communication, and work/life balance prepare students • Civic Engagement & Service – using computing to serve others increases engagement and changes the image of computing • Community – a computing identity and sense of belonging within a larger computing community lead to retention and advancement in computing Significant Outcome Demonstration Projects STARS Increases Enrollment – Research schools who implemented the SLC for 3 years increased enrollment in graduate computing programs by 32%, while national enrollment declined by 2%. Mentoring Identity-based tiered mentoring through common service in the SLC. Contact:E. Nathan Thomas, nathomas@poly.usf.edu • Get Involved: Apply for Funding • Adapt or Adopt the STARS Leadership Corps . . . • as a credit-bearing course or co-curricular program • Participate in the STARS Celebration . . . • offer a session or workshop; convene your project participants at the Celebration; individual students and faculty interested in participating can apply • Apply for Funding to Get Involved… • email Karen Bean (Karen.Bean@uncc.edu) Grad+UG computing enrollments in STARS Schools. First 10 STARS schools began 2007 (green). Second 10 STARS schools began 2009 (blue). Pair Programming Students work in pairs on programming assignments to provide peer support and increase student learning. Contact:Laurie Williams, Williams@csc.ncsu.edu Tiered REU - new Leverage A4RC courseware and practices to prepare undergraduates for research experiences (REUs). Contact: Tiffany Barnes, Tiffany.Barnes@uncc.edu
Assessing your poster? • CONTENT: • Did the poster capture the technical essence of the whole project? • ORGANIZATION OF PRESENTATION AND EMPHASIS: • Was the story-line well organized and easy to follow? Were important points highlighted? • CLARITY OF PRESENTATION: • How well are the main points made? How well is the textual information presented? How well the textual, pictorial and graphical information augment each other? Can someone understand the information without clarification? • USE AND QUALITY OF VISUAL AIDS: • Were they appropriate and clear? Were they of good quality? Were they clearly and effectively presented? • RESPONSE TO QUESTIONS FROM THE AUDIENCE: • (When you present it to other EAs, and at the Celebration) • Are you able to explain? Are you confident and poised?