RELIABILITY ANALYSIS AT ESS: EXCEL-BASED MODEL
RELIABILITY ANALYSIS AT ESS: EXCEL-BASED MODEL. CERN, 2014-04-29. Odei Rey Orozko. Overview on Reliability Analysis Overall Reliability Goal for ESS Overview on the Statistical model How the Excel based model works Example: Outcome and interpretation. CONTENT.


RELIABILITY ANALYSIS AT ESS: EXCEL-BASED MODEL
E N D
Presentation Transcript
RELIABILITY ANALYSIS AT ESS: EXCEL-BASED MODEL CERN, 2014-04-29 Odei Rey Orozko
Overview on Reliability Analysis Overall Reliability Goal for ESS Overview on the Statistical model How the Excel based model works Example: Outcome and interpretation CONTENT
OVERVIEW ON RELIABILITY ANALYSIS Base • Reliability Analysis - November 2012 - Rebecca Seviour. • All systems were listed in one excel file - 600 lines. • Different types of redundancy and repair cases were assumed to fine-tune the overall LINAC reliability and availability numbers. • Mission time = 144 h = 6 days. Preliminary Reliability Analysis: Excel based model • Created one excel file per system. • Removed redundancy and repair assumptions. • Mission time = 1h according to input from XFWG on reliability (more later). • Identify failure rate/MTBF data source. • Identify and redefine structures and formulas behind. • Created statistical macro that calculates the overall reliability and availability numbers and creates a structure graph of the system.
OVERVIEW ON RELIABILITY ANALYSIS • Why Excel-Based Model as a Preliminary Analysis? • Excel is accessible to everyone • No need of previous knowledge in reliability analysis • Good starting point for design issues and data collection • This preliminary analysis can be used after in more sophisticated software by experts
OVERALL RELIABILITY GOAL FOR ESS Preliminary Allocation: • The ESS goal is to achieve an overall reliability of 95%. • Time interval was chosen to be 1 hour, due to length of user-experiments. • Accelerator numbers are already in AD requirements documents. Other allocations have to be confirmed. • The Accelerator is considered to be OFF (ie downtime) if beam power is less than 50% of currently scheduled power for more than 1 minute.
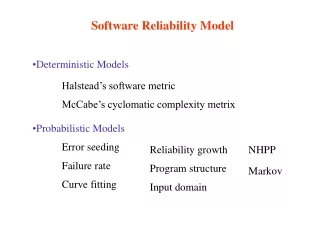
OVERVIEW ON THE STATISTICAL MODEL • The model differentiates three cases / designs / structures. • For each case, a different: • Approach is used for the calculations. • Input data-set is needed.
OVERVIEW ON THE STATISTICAL MODEL INPUT: Mechanical Tuner Assembly Vacuum Valve CASE 1: - MTBF - Percent of Anticipated Failures - No. of Equip. - MTTR SCRF Cavity SCRF Cavity / Module Tuner Assembly / Module Vacuum Valve / Module Cryostat structure CASE 2: - No. of Equip. CRYOSTAT CASE 3: No input data needed!
OVERVIEW ON THE STATISTICAL MODEL OUTPUT: • Failure rate • Effective MTBF for Unanticipated Failure • Effective Failure rate • Effective Total Failure Rate • Mean Down Time (MDT) • Steady State Availability • Reliability for Mission Time • Which formulas are usedonthestatisticalmodel? • Depending on the case, redundancy and repair values • For example, for Reliability and Availability…
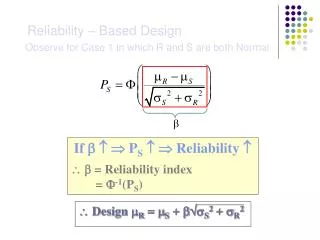
OVERVIEW ON THE STATISTICAL MODEL FORMULAS FOR AVAILABILITY AND REALIABILITY: CASE 1 and no use of additional components!
EXAMPLES: MAGNETS Magnets – DUMP LINES
THANK YOU! Odei Rey Orozko o.rey.oroz@gmail.com
HOW THE MACRO WORKS • When clicking the ANALYSIS button: • Read input data. • From the user: the corresponding cell in the file. • From another system’s calculations: file name in column “H”. • Fills cells in grey where the user must enter the input data. • Checks if input data is missing. • If input is missing, error message! • If not, continue to analysis? • Analysis: Calculates all numbers according to the statistical model. • Graph? If yes, creates a structure graph of the system in the second sheet of the same file.
RELIABILITY / AVAILABILITY MACROS Case: No use of additional components. AVAILABILITY MACRO: RELIABILITY MACRO:
BASIC CONCEPTS: REDUNDANCY Redundancy: The use of additional components or sub-systems beyond the number actually required for the system to operate reliably/available. For improving the Reliability/Availability C1 C2 C1 C2 C1 C2 Consider a system with two elements C1 and C2. A similar system in parallel is added to the existing one.
BASIC CONCEPTS: REDUNDANCY Redundancies can be categorized as ACTIVE or PASSIVE (STAND-BY). • ACTIVE redundancy : • All redundant components are in operation and sharing the load with the main component. • Upon failure of one component, the surviving components carry the load. • PASSIVE or STAND BY redundancy: • All redundant components remain dormant until needed. • The redundant components systems start operating only when one or more failures occur. Active Passive A A Switch B B Reliability/Availability (ACTIVE) << Reliability/Availability (PASSIVE)
BASIC CONCEPTS: REDUNDANCY ACTIVE << PASSIVE • Assume Avail(A)=Avail(B)=Avail(C)=Avail(D). • Components A, B and C start operating at t=0. • Component D does not start operating until C fails. • Hence, system with Passive redundancy should have a higher availability. A Component A Active Component B B C Component C Passive Switch Component D D t=0 t=Failure of Component C and A