Download
1 / 17
170 likes | 452 Views
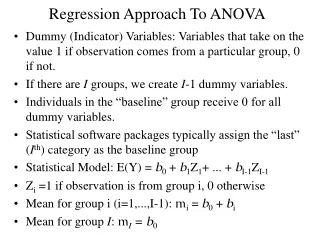
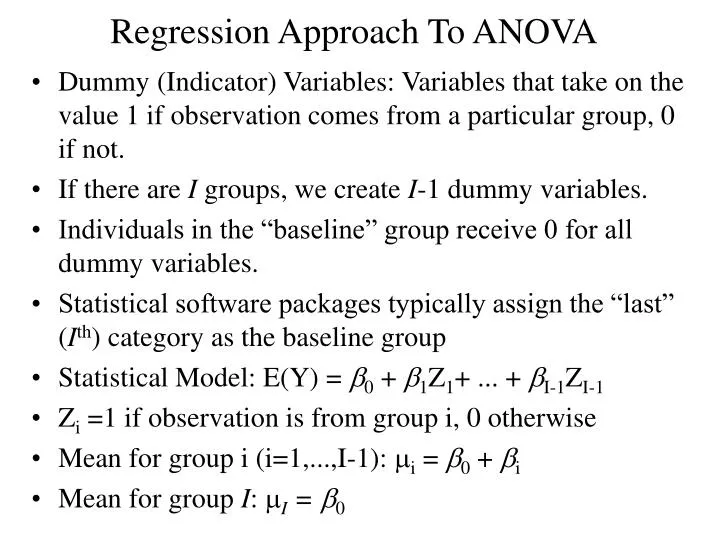
Regression Approach To ANOVA. Dummy (Indicator) Variables: Variables that take on the value 1 if observation comes from a particular group, 0 if not. If there are I groups, we create I -1 dummy variables. Individuals in the “baseline” group receive 0 for all dummy variables.

E N D
Regression Approach To ANOVA • Dummy (Indicator) Variables: Variables that take on the value 1 if observation comes from a particular group, 0 if not. • If there are I groups, we create I-1 dummy variables. • Individuals in the “baseline” group receive 0 for all dummy variables. • Statistical software packages typically assign the “last” (Ith) category as the baseline group • Statistical Model: E(Y) = b0 + b1Z1+ ... + bI-1ZI-1 • Zi =1 if observation is from group i, 0 otherwise • Mean for group i (i=1,...,I-1): mi = b0 + bi • Mean for group I: mI = b0
2-Way ANOVA • 2 nominal or ordinal factors are believed to be related to a quantitative response • Additive Effects: The effects of the levels of each factor do not depend on the levels of the other factor. • Interaction: The effects of levels of each factor depend on the levels of the other factor • Notation: mij is the mean response when factor A is at level i and Factor B at j
Example - Thalidomide for AIDS • Response: 28-day weight gain in AIDS patients • Factor A: Drug: Thalidomide/Placebo • Factor B: TB Status of Patient: TB+/TB- • Subjects: 32 patients (16 TB+ and 16 TB-). Random assignment of 8 from each group to each drug). Data: • Thalidomide/TB+: 9,6,4.5,2,2.5,3,1,1.5 • Thalidomide/TB-: 2.5,3.5,4,1,0.5,4,1.5,2 • Placebo/TB+: 0,1,-1,-2,-3,-3,0.5,-2.5 • Placebo/TB-: -0.5,0,2.5,0.5,-1.5,0,1,3.5
ANOVA Approach • Total Variation (SST) is partitioned into 4 components: • Factor A: Variation in means among levels of A • Factor B: Variation in means among levels of B • Interaction: Variation in means among combinations of levels of A and B that are not due to A or B alone • Error: Variation among subjects within the same combinations of levels of A and B (Within SS)
ANOVA Calculations • Balanced Data (n observations per treatment)
ANOVA Approach General Notation: Factor A has I levels, B has J levels • Procedure: • Test H0: No interaction based on the FAB statistic • If the interaction test is not significant, test for Factor A and B effects based on the FA and FB statistics
Example - Thalidomide for AIDS Individual Patients Group Means
Example - Thalidomide for AIDS • There is a significant Drug*TB interaction (FDT=5.897, P=.022) • The Drug effect depends on TB status (and vice versa)
Regression Approach • General Procedure: • Generate I-1 dummy variables for factor A (A1,...,AI-1) • Generate J-1 dummy variables for factor B (B1,...,BJ-1) • Additive (No interaction) model: Tests based on fitting full and reduced models.
Example - Thalidomide for AIDS • Factor A: Drug with I=2 levels: • D=1 if Thalidomide, 0 if Placebo • Factor B: TB with J=2 levels: • T=1 if Positive, 0 if Negative • Additive Model: • Population Means: • Thalidomide/TB+: b0+b1+b2 • Thalidomide/TB-: b0+b1 • Placebo/TB+: b0+b2 • Placebo/TB-: b0 • Thalidomide (vs Placebo Effect) Among TB+/TB- Patients: • TB+: (b0+b1+b2)-(b0+b2) = b1 TB-: (b0+b1)- b0 = b1
Example - Thalidomide for AIDS • Testing for a Thalidomide effect on weight gain: • H0: b1 = 0 vs HA: b1 0 (t-test, since I-1=1) • Testing for a TB+ effect on weight gain: • H0: b2 = 0 vs HA: b2 0 (t-test, since J-1=1) • SPSS Output: (Thalidomide has positive effect, TB None)
Regression with Interaction • Model with interaction (A has I levels, B has J): • Includes I-1 dummy variables for factor A main effects • Includes J-1 dummy variables for factor B main effects • Includes (I-1)(J-1) cross-products of factor A and B dummy variables • Model: As with the ANOVA approach, we can partition the variation to that attributable to Factor A, Factor B, and their interaction
Example - Thalidomide for AIDS • Model with interaction:E(Y)=b0+b1D+b2T+b3(DT) • Means by Group: • Thalidomide/TB+: b0+b1+b2+b3 • Thalidomide/TB-: b0+b1 • Placebo/TB+: b0+b2 • Placebo/TB-: b0 • Thalidomide (vs Placebo Effect) Among TB+ Patients: • (b0+b1+b2+b3)-(b0+b2) = b1+b3 • Thalidomide (vs Placebo Effect) Among TB- Patients: • (b0+b1)-b0= b1 • Thalidomide effect is same in both TB groups if b3=0
Example - Thalidomide for AIDS • SPSS Output from Multiple Regression: We conclude there is a Drug*TB interaction (t=2.428, p=.022). Compare this with the results from the two factor ANOVA table
Repeated Measures ANOVA • Goal: compare g treatments over t time periods • Randomly assign subjects to treatments (Between Subjects factor) • Observe each subject at each time period (Within Subjects factor) • Observe whether treatment effects differ over time (interaction, Within Subjects)
Repeated Measures ANOVA • Suppose there are N subjects, with ni in the ith treatment group. • Sources of variation: • Treatments (g-1 df) • Subjects within treatments aka Error1 (N-g df) • Time Periods (t-1 df) • Time x Trt Interaction ((g-1)(t-1) df) • Error2 ((N-g)(t-1) df)
Repeated Measures ANOVA To Compare pairs of treatment means (assuming no time by treatment interaction, otherwise they must be done within time periods and replace tn with just n):