Download
1 / 25
250 likes | 374 Views
Outcome of Conditional Grants & Capital Expenditure as at 31 December 2006 [Section 32 of PFMA]. Select Committee on Finance National Council of Provinces Presented by: Intergovernmental Relations and Public Finance National Treasury February 2007. Key priorities for 2006 MTEF (1).

E N D
Outcome of Conditional Grants & Capital Expenditure as at 31 December 2006[Section 32 of PFMA] Select Committee on Finance National Council of Provinces Presented by: Intergovernmental Relations and Public Finance National Treasury February 2007
Key priorities for 2006 MTEF (1) • Education • Reduce backlog in school equipment; • Expand Grade R; • Facilitate teacher development and HRM systems; • Extend new curriculum to grades 10-12; and • Implement norms and standards for school funding, special schools and expand information management systems.
Education (1) • Spending at R58,0bn or 72,3% against R80,2bn adjusted budget, projecting to overspend by R635,6m (mostly personnel) • Increase of R5,1bn or 9,5% compared to the previous year • Low rate of education spending in GP (68,8%) and MP (71,5%) • KZN (75,2%) and NC (75,1%) reflects the highest rate of spending in education • Education Personnel spending at R46,6bn or 74,1% (R62,9bn adjusted budget) • Projecting to overspend by R518,7m • Goods and services (mostly LSM) at R5,1bn or 56,0% (R9,0bn adjusted budget) • Capital spending at R2,4bn or 61,4% • Significant increase of R834,7m or 54,9% compared to spending last year • Wide fluctuations compared to last year 3rd quarter y-to-d • Low rate of capital spending in WC (49,5%) and KZN (50,8%) • FS (76,6%) and NC (73,6%) reflects the highest rate of capital spending in education
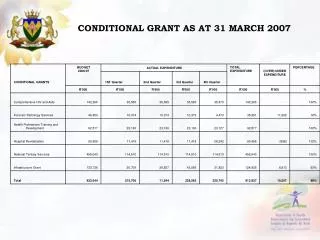
Payments for Capital Assets (Education and Health) • Education capital spending at R2,4bn or 61,4% • Increase of R834,7m or 54,9% compared to spending last year • Wide fluctuations compared to last year 3rd quarter • Low rate of education capital spending in WC (49,5%) and KZN (50,8%) • FS (76,6%) and NC (73,6%) reflects the highest rate of capital spending in education
Conditional Grants (2) • Spending on the Further Education and Training College Sector Recapitalisation grant is at 97,0 per cent or R456,0 million and reflects actual transfers from the provincial education departments to the FET colleges • FET colleges expenditure is at 41,1 per cent or R187,4 million of the R456,0 million transferred from the provincial education departments • Expenditure by college published for the first time • Information provided by national Department of Education
Education GrantsFurther Education and Training College Sector Recapitalisation Grant • Objectives (Schedule 5 Grant): • To recapitalise the 50 public FET Colleges to improve their capacity to contribute to skills development training in the country • 3rd Quarter Expenditure: • FET College Sector Recap grant reflects transfers to colleges • Provincial education transferred R456m or 97% to the FET Colleges of the available R470,0m allocation • Spending of FET colleges published in Section 32 for the first time - R187,4m • Service Delivery Outcome: • Department / Sector to respond
Education GrantsNational School Nutrition Programme Grant • Objective (Schedule 5 Grant): • To contribute to enhanced learning capacity through school feeding • 3rd Quarter Expenditure: • Education spent R889,6m or 72,8% of the R1,2bn adjusted allocation (includes provincial roll-overs) • Transfers received amounted to 75,0% of national allocation • Highest spending: NW (87,1%); LP (85,9%) and MP (74,4%) • Lowest spending: EC (59,2%); FS (64,1%) and GP (70,5%) • Service Delivery Outcome: • Department / Sector to respond
Education GrantsHIV and Aids Grant (Life Skills Education) • Objectives (Schedule 5 Grant): • To coordinate and support the structured integration of life skills and HIV and Aids programmes across all learning areas in the school curriculum • To ensure access to an appropriate and effective, integrated system of prevention, care and support for children infected and affected by HIV and Aids • To deliver life skills, sexuality and HIV and Aids education programmes in primary and secondary schools • 3rd Quarter Expenditure: • Education spent R95,4m or 65,3% of the R146,2m adjusted allocation (includes provincial roll-overs) • Transfers received amounted to 71,3% of national allocation • Highest spending: FS (91,9%); MP (82,0%) and EC (81,8%) • Lowest spending: LP (46,9%); GP (55,2%) and NC (55,5%) • Service Delivery Outcome: • Department / Sector to respond
THANK YOUTHANK YOU THANK YOU