Download
1 / 70
770 likes | 1.17k Views
Observational Study Designs and Confounding. Michael A. Kohn, MD, MPP 26 August 2008. Outline. Single Sentence Study Description REVIEW Observational study designs Definition of a confounder Coping with Confounding

E N D
ObservationalStudy Designs andConfounding Michael A. Kohn, MD, MPP 26 August 2008
Outline • Single Sentence Study Description • REVIEW Observational study designs • Definition of a confounder • Coping with Confounding • Examples of observational designs (“Name that Design”) and approaches to the problem of confounding
Single-Sentence Study Description “The [cute acronym] study is a [DESIGN] study of the association between [predictor] and [outcome] in [study population].” Exercise for section today: Present your study with a sentence like this.
Study Design • Not just a matter of semantics • Weaknesses and strengths associated with each study design • Different measures of disease association • Worth getting right or at least thinking about
Study Designs • Experimental -- Randomized controlled trial (next week) • Observational (today’s topic) -- Cohort -- Double Cohort (risk-no risk; exposure-no exposure) -- Cross-sectional -- Case-control
Experimental vs. Observational • Predictor = intervention (treatment or therapy): • -- experiment (randomized controlled trial)* • -- observational study • Predictor = exposure or risk factor: • -- observational study *Not all treatments require RCTs to prove effectiveness.
OBSERVATIONAL STUDIES • Usually the only option if the predictor is a potentially harmful exposure or risk factor • Even if the predictor is an intervention, an RCT may not be feasible • Confounding always an issue • Many observational studies also qualify as secondary data analysis • More intellectually interesting than RCTs?
Note on Figures The schematics of observational study designs that follow assume that you are studying the association between a risk factor and development of a disease. • Predictor = Risk Factor • Outcome = Disease
Cohort Studies • Determine predictor status on all patients in a single population (defined by something other than the predictor). Exclude any patients who already have the outcome. • Follow patients over time and attempt to determine outcome in all subjects • Can identify individuals lost to follow up • Can measure overall incidence of outcome in the population (e.g., cases/person-year) • Measure of disease association is the relative risk (RR) or relative hazard (RH)
Double Cohort (Exposure-No Exposure) Studies • Sample study subjects based on predictor status. • Attempt to determine outcome in all subjects over time • Can identify individuals lost to follow up • Cannot measure overall incidence of outcome in the population (e.g., cases/person-year) • Measure of disease association is the relative risk (RR) or relative hazard (RH)
Cohort Studies: Sampling Frame vs. Time Frame Time Frame: All cohort studies are longitudinal (follow patients over time). Sampling Frame: Double cohort study -- samples on predictor status, i.e. there are separate predictor-positive and predictor-negative samples. Cohort study -- starts with a cross-sectional sample (a population defined by something other than the predictor variable).
Cohort Studies: Prospective vs. Retrospective Prospective – Predictor status collected as part of this study Retrospective – Predictor status collected by someone else in the past (another study, medical records, etc.) It’s a cohort study if you follow predictor-positive and predictor-negative subjects over time for development of the outcome and if you can identify the subjects lost to follow up. Don’t worry too much about retrospective vs. prospective!
Case-Control Study • Separately sample subjects with the outcome (cases) and without the outcome (controls) • Attempt to determine predictor status on all subjects in both outcome groups • Cannot identify individuals lost to follow up (no such thing as “lost to follow up”, since by definition outcome status is known) • Cannot calculate prevalence (or incidence) of outcome • Measure of disease association is the Odds Ratio (OR) • Trying to replicate a nested case control study in which the cases and controls come from the same cohort.
Cross-Sectional Study • Attempt to determine predictor and outcome status on all patients in a single population (defined by something other than predictor and outcome). • Cannot identify individuals lost to follow up (no such thing as “lost to follow up”) • Can calculate prevalence but not incidence • Measure of disease association is the Relative Prevalence (RP). • Time frame is the same as for a case-control study; both discussed in Hulley, Chapter 8
Cohort Studies Start with a Cross-Sectional Study Eliminate subjects who already have disease
Causal Association Between Predictor and Outcome • Does predictor cause outcome? • For now, not interested in studies of diagnostic/prognostic tests. (Test result does not cause outcome. See Ch. 12.)* • Not interested in descriptive studies. *How many of you are doing studies of diagnostic/prognostic tests?
Errors in Causal Inference • Conclude that predictor causes outcome when, in truth, it doesn’t (false positive study) • Fail to conclude that predictor causes outcome when, in truth, it does (false negative study)
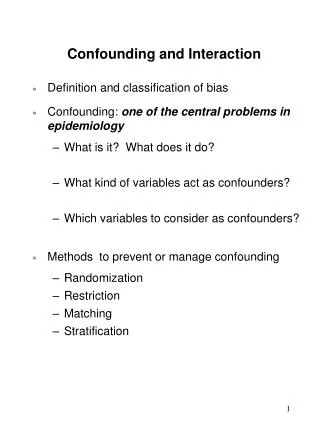
Sources of Error • Chance • Bias • Confounding
Sources of Error: Confounding Association between predictor and outcome is “real” – but not causal.
Confounding In Observational Studies of a Treatment Predictor = Treatment
Sources of Error: Confounding Treatment Confounder Association or Reduces Risk Cause Outcome Looks Good Falsely conclude that treatment improves outcomes
Confounding: Vitamin E Diet, Exercise, Health Awareness? Vitamin E Association True Cause Cause Fewer CAD events False Cause
Confounding: Suppression or Confounding by Indication Treatment Suppressor Association Worsens Cause Appears to Worsen Outcome Improves Falsely conclude that treatment does not improve or even worsens outcome
Confounding by Indication : Diuretic Therapy Severity of Disease Diuretics Association Increases Cause Appears to Worsen CVD Mortality Decreases Falsely concluded that diuretics increased CVD mortality Warram JH, et al. Excess mortality associated with diuretic therapy in diabetes mellitus. Arch Intern Med 1991;151(7):1350-6. Turnbull, F., et al. (2005). "Effects of different blood pressure-lowering regimens on major cardiovascular events in individuals with and without diabetes mellitus.” Arch Intern Med165(12): 1410-9.
Intermediates An intermediate on the causal pathway between predictor and outcome will look like a confounder. A cohort study of HIV-infected pregnant women shows an association between protease inhibitor-based HAART and low birth weight. Should we control for maternal weight gain during pregnancy?
IS IT THIS? Low maternal weight gain PI-Based HAART Association True Cause Cause Low Birth Weight False Cause
OR THIS? Low maternal weight gain PI-Based HAART Cause Cause Low Birth Weight
Coping with ConfoundingDesign Phase • Specification • Matching • Instrumental Variable • Associated with the predictor of interest but not independently associated with the outcome • Look for association between instrumental variable and outcome
Assessing the Importance of Confounding • Alternative Outcome • Caused by confounders but not by the primary predictor • If still associated with the primary predictor, confounding is a problem • Alternative Predictor • Associated with same confounders as main predictor but not thought to cause the outcome • If still associated with the outcome, confounding is a problem
Coping with ConfoundingAnalysis Phase* • Stratification • Statistical Adjustment • Propensity Scores *Have to measure potential confounders
Examples Name that observational study design Address issue of confounding
AZT Prophylaxis after Needlestick in Health Care Workers The proportion receiving AZT prophylaxis was compared between health care workers who sero-converted after a needlestick and health care workers who did not seroconvert after a needlestick. DESIGN? Cardo et al. N Engl J Med 1997;337(21):1485-90.
AZT Prophylaxis after Needlestick in Health Care Workers Confounding? Cardo et al. N Engl J Med 1997;337(21):1485-90.
Suppression: AZT after Needlestick Deep Stick, Visible Blood on Needle AZT Association Increases Cause Appears to Increase HIV Sero-conversion Decreases Unadjusted analysis showed statistically insignificant effect of AZT in reducing seroconversion
AZT Prophylaxis after Needlestick in Health Care Workers Logistic Regression Model Adjusting for Deep Stick, Visible Blood on Device MVOR = 0.14 (95% CI 0.03-0.47) Cardo et al. N Engl J Med 1997;337(21):1485-90.
Enhancing Causal Inference Statistical Adjustment (Multivariable Modeling) Katz, M. H. (2006). Multivariable analysis : a practical guide for clinicians. Cambridge ; New York, Cambridge University Press.
Effect of Flu Vaccination on All-Cause Mortality During the Flu Season The study population included almost 300,000 subjects at least 65 years old, of whom about 58% were vaccinated. Among vaccinated and unvaccinated subjects, 1.2% and 2.0% respectively died during the flu season. Pooled computerized data from 3 large managed care organizations. Study Design? Nichol et al. N Engl J Med. Apr 3 2003;348(14):1322-1332.
Effect of Flu Vaccination on All-Cause Mortality During the Flu Season Could confounding explain the association between flu vaccination and decreased risk of death during the flu season?
Effect of Flu Vaccination on All-Cause Mortality During the Flu Season“Healthy Vaccinee Bias” Flu Vaccination Better health, better health care, other confounders Association Decreases Cause Death During Flu Season False Effect
Effect of Flu Vaccination on All-Cause Mortality During the Flu Season How might you assess the importance of confounding?
Enhancing Causal InferenceMeasure Alternative Outcome If worried about confounding, measure another outcome that could be caused by the confounder but NOT by the predictor of interest. If there is NO association between the predictor of interest and the alternative, causally unrelated outcome, then the relationship between the primary predictor and the outcome is more likely to be causal.
Effect of Flu Vaccination on All-Cause Mortality During the Flu Season Flu Vaccination Better health care, other confounders Association Decreases Cause Appears to Decrease Death During Summer Months Should Not Affect If the association of flu vaccination and decreased mortality during the flu season were due to confounding, then vaccination should also appear to reduce death during the summer months.
Effect of Flu Vaccination on All-Cause Mortality During the Flu Season “Our analysis for evidence of a healthy-vaccinee bias was negative; during the two noninfluenza periods for which we had information, vaccinated and unvaccinated persons had similar risks of hospitalization” Nichol, K. L., J. D. Nordin, et al. (2007). "Effectiveness of influenza vaccine in the community-dwelling elderly." N Engl J Med357(14): 1373-81.
Health Professionals Follow-up Study • In 1986, 39,910 male dentists, veterinarians, pharmacists, optometrists, and podiatrists filled out a questionnaire including information about Vitamin E intake (the predictor) • In 1988 and 1990, vital status was determined and those who were still alive were re-contacted to see if they had developed coronary artery disease (the outcome). Death/disease rates were lower in those who took Vitamin E. Design? Rimm, E. B., M. J. Stampfer, et al. (1993). "Vitamin E consumption and the risk of coronary heart disease in men." N Engl J Med328(20): 1450-6.