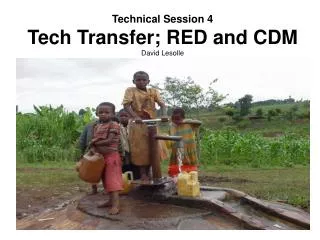
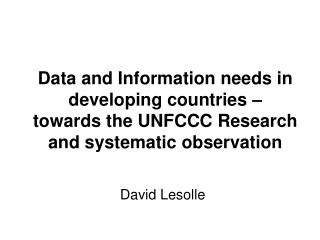
David Lesolle
Data and Information needs in developing countries – towards the UNFCCC Research and systematic observation. David Lesolle. The Climate System. Energy Balance. Hydrological Cycle. The Global Carbon Cycle. Estimating the Magnitude of the Natural Greenhouse Effect. Net Incoming Solar Energy.

David Lesolle
E N D
Presentation Transcript
Data and Information needs in developing countries – towards the UNFCCC Research and systematic observation David Lesolle
Estimating the Magnitude of the Natural Greenhouse Effect Net Incoming Solar Energy Outgoing Heat Energy = (S0 (1-A) R2) (4R2kTe4) where S0 is the solar constant A is average albedo, or reflectivity R is the radius of the earth k is Boltzmann’s constant Te is earth’s apparent temperature (seen from space) Te equals -19C However, average global surface T is + 14C Natural greenhouse effect warms the surface by 33C
Atmospheric CO2 Concentration (Site:Mauna Loa; 2004: 379ppm)
325 300 275 CO2 250 Concentration 225 (ppmv) 200 175 150 Atmospheric CO2 concentration and temperature variations Vostok, 4 2 0 Temperature(℃) -2 -4 -6 -8 -10 400,000 300,000 200,000 100,000 0 年距今
Need an Integrated Global Observing System Going Beyond the WWW
GCOS was established in 1992 • To ensure that the observations and information needed to address climate-related issues are obtained and made available to all potential users. • Co-sponsored by: • The World Meteorological Organization (WMO) • The Intergovernmental Oceanographic Commission (IOC) of UNESCO • The United Nations Environment Programme (UNEP) • The International Council for Science (ICSU).
Background Global Climate Observing System (GCOS) implementation plan - for adoption by the COP at its thirteenth session. • The revision of the “UNFCCC reporting guidelines on global climate change observing systems”; • The progress reports by the GTOS secretariat, and to identify possible actions in improving global terrestrial climate observations.
GCOS and the UN Framework Convention on Climate Change • Research and systematic observations (COP-5 in Bonn, 1999): • Parties to Provide Detailed National Reports • GCOS Guidance Adopted • Voluntary for non-Annex 1 Parties (Developing Nations) • WMO GCOS Office to Develop Synthesising Process • Organize Regional GCOS Capacity Building Workshops • This workshop is not a GCOS workshop • Report on Deficiencies in Observing Systems • Facilitate Intergovernmental Coordination
Deepening Understanding on Climate • From Climate to climate system • Climate is not only temperature, pressure, and humidity • Climate is changing • 30 year normal is also changeable • Climate is not only controlled by consistent solar radiation, geographic features, and atmospheric circulation
Atmosphere Observation • Most organized system • Two basic sub-systems: WWW, GAW • Continuous observation for atmospheric dynamics, physics and chemical process is crucial for climate change study. • Contents: circulation, composition, surface elements, cloud and radiation etc.
Extreme weather event • An extreme weather event is an event that is rare within its statistical reference distribution at a particular place. • Definitions of “rare” vary, but an extreme weather event would normally be as rare as or rarer than the 10th or 90th percentile. By definition, my rare is not necessarily your rare…. • An extreme climate event is an average of a number of weather events over a certain period of time, an average which is itself extreme (e.g. rainfall over a season).
A Variety of Forecasts Weather • mostly regional, short-lived events • Deterministic forecasts • protection of life Seasonal climate • Global, seasons in advance • Probabilistic forecasts – deviations from normal seasons • Mitigation – energy; food; water; health, etc sectors Climate change scenarios • Global, visions of the future • Includes chemistry and biology modeling • Projections of possible future changes to climatology • Understanding unintended consequences & adaptation • Solving the “carbon” problem
Some New Forecast Products • Food Security and Health • Drought including interactive vegetation • Heat threats • Pollution • Coastal ecosystems • Adaptation • Sea Level These will be needed even without significant global warming impacts
Likely Future Product Cycle and Players ‘Prototype’ ‘Reliability’ ‘Convenience’ ‘Public’ Research entities Specialized centers by region or sector Private Sector NMHSs • Some Future Think • Think interdisciplinary • Think specialized centers • Think new partnerships
The framework for service provision- fundamental common features of the established system
Your Capability/Capacity is Challenged (I) • Technology progresses faster than the demand for new products • Since these are not your main products, developmental resources will be inadequate • new demand must be generated -oceanographers and climate guys will play this role • You are failure adverse – new products entail risks • The niche will be filled. Since your core business is elsewhere, the opportunity exists for innovators to move in • Who will the new players be?
Your Capability/Capacity is Challenged (II) Historical climate change data mainly come from two sources: - Operational services of weather forecast, aviation and navigations. - Scientific experiment and programmes: WCRP, IGBP Strength: Long records Weakness: not persistent, changes in instruments, station locations, observation practices. Also, temporal and spatial uneven.