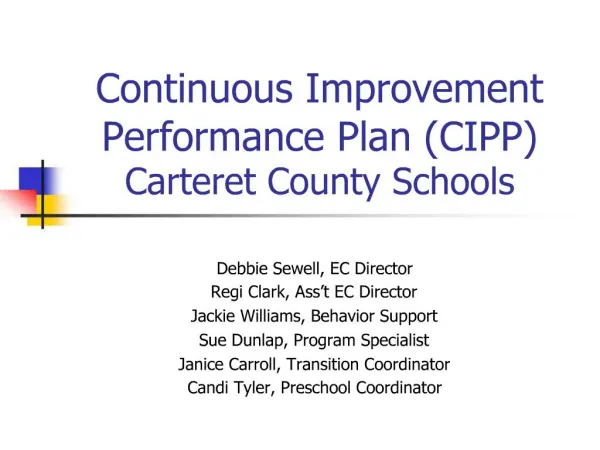
Continuous Improvement Performance Plan for Students with Disabilities in New Hanover County Schools
The Continuous Improvement Performance Plan (CIPP) outlines the graduation rates, drop-out percentages, assessment participation, and performance of students with disabilities (SWD) in New Hanover County Schools. Key indicators include graduation rates (target: 80%), drop-out rates (target: 6.0%), and early childhood outcomes. The plan emphasizes intensive training in research-based reading and math instruction, increased parental involvement, and monitoring of short-term suspension processes. New Hanover County Schools aims to meet compliance and improve outcomes for SWD through targeted strategies and continuous evaluation.

Continuous Improvement Performance Plan for Students with Disabilities in New Hanover County Schools
E N D
Presentation Transcript
Continuous Improvement Performance Plan (CIPP) New Hanover County Schools Students with Disabilities Data Story
Indicator 1Graduation Rate Percent of youth with IEPs graduating from high school with a regular diploma. State Target: 80%; State Average: 59.8% 1112 – SWD met AMO w/ Improvement
Indicator 2Drop Out Percent of youth with IEPs dropping out of high school. State Target: 6.0%; State Average: 5.2%
Indicator 3Assessment Participation & Performance/Reading 0809 & 0910 – SWD made AYP in grades 3-8 1112 –SWD met AMO in Grades 3-8 & 10 Participation Performance
Indicator 3Assessment Participation & Performance/Math 0809 & 0910 – SWD made AYP in grades 3-8 1112 – SWD met AMO in grades 3-8 & 10 Participation Performance
Indicator 4aLTS Suspension/Expulsion Rates of suspension and expulsion of students with disabilities greater than 10 days in a school year that is twice the state average or greater (0.36%).
Indicator 4bShort-term Suspension Rates of cumulative short suspension of students with disabilities greater than 10 days in a school year by race and ethnicity that is greater than the state disproportionality target. State Target: 5%; State Average: N/A
Indicator 5Least Restrictive Environment Percent of children with IEPs aged 6 through 21 served in regular, separate, or public, private, home or hospital settings.
Indicator 6Preschool LRE • No data or targets set at this time
Indicator 7Early Childhood Outcomes Percent of preschool children with IEPs who demonstrate improvement in positive social-emotional skills, acquisition and use of knowledge and skills, and use of appropriate behaviors to meet their needs. A. % Substantially improvement by age 6 B. % Functioning at age 6
Indicator 8Parent Involvement Percent of parents with a school age child receiving special education services who report that schools facilitated parent involvement as a means of improving service and results for children with disabilities. State Target: 40%. 08-09 43.0%
Indicator 9Disproportionality Spec Ed Percent of districts with disproportionate representation of racial and ethnic groups in special education and related services that is the result of inappropriate identification. State Target 0% NHCS 0%
Indicator 10Disproportionality by Category NHCS data indicate disproportionate representation of racial and ethnic groups in specific disability categories that is the result of inappropriate identification. State target: 0% NHCS:
Indicator 1190 Day Timeline Percent of children referred for whom a referral was received and placement determined within 90 days. State Target: 100%
Indicator 12Part C to Part B Percent of children referred by Part C prior to age 3 and who are found eligible for Part B who receive special education and related services by their third birthday. State Target: 100%
Indicator 13IEPs and Postsecondary Goals Percent of youth aged 16 and above with an IEP that includes coordinated, measurable, annual IEP goals and transition services that will reasonably enable the child to meet the postsecondary goals.
Indicator 13IEPs and Postsecondary Goals State Target: 100%
Indicator 14Post-School Outcomes Percent of youth who had IEP’s, are no longer in secondary school and who have been competitively employed, enrolled in some type of postsecondary school, or, both, within one year of leaving high school. State Baseline Data: 75% NHCS Baseline: 70%
Indicator 15General Supervision Part 1 Percent of noncompliance identified and corrected within one year. State Target: 100%
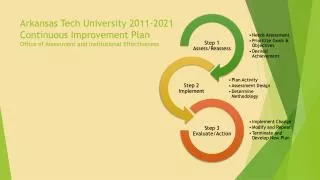
What’s the Plan (PreK-12)? • Training in Intensive Scientific, Research-based Reading and Math instruction • KU Content Literacy Continuum (Secondary Pilot) • Superintendent’s Graduation-Dropout Task Force • Response to Instruction (RTI) K-8 & Preschool Play Based Assessment • Increase School-wide Positive Behavior Support Sites • Targeted re-evaluations of SED and IDMI • Re-training and monitoring of Short-term suspension processes
What are the consequences? IDEA 2004 – 34 CFR 300.604 • Meets Requirements (NHCS status – 08-09, 09-10, & 10-11) • Needs Assistance – Direct the use of funds • Needs Intervention – Withhold funds • Needs Substantial Intervention – Recover Funds