Download
1 / 54
660 likes | 1.35k Views
Capacity Planning: Long-Term & Short-Term. This presentation explores: The nature of strategic capacity planning Capacity terminology Determining capacity requirements Decision trees Service capacity planning. Strategic Capacity Planning. Capacity

E N D
Capacity Planning: Long-Term & Short-Term • This presentation explores: • The nature of strategic capacity planning • Capacity terminology • Determining capacity requirements • Decision trees • Service capacity planning ....
Strategic Capacity Planning • Capacity • The amount of resource inputs available relative to output requirements at a particular time • Strategic Capacity Planning (Long-Range) ....
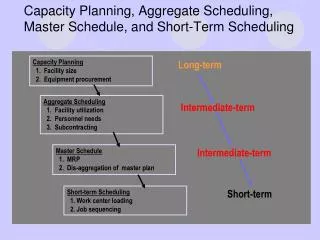
Planning Time Frames • Long range - more than 1 year and involves top management e.g. buildings, facilities, specialized equipment • Intermediate range - 6 to 18 months: monthly/quarterly plans; capacity varied by hiring, firing, tool improvement, etc. • Short range - less than I month: overtime, transfers, routings, etc.
Best Operating Level Average unit cost of output Underutilization Over Utilization Best Operating Level Volume ....
Capacity Utilization (does not account for operating efficiency) • Design capacity • maximum obtainable output • Capacity used • rate of output actually achieved ....
Utilization--Example • Design capacity = 120 units/week • Actual output = 83 units/week • Utilization = ? ....
Economies of Scale & Long-term Capacity Planning • Economy of Scale combined with Experience Curve could be a • competitive strategy 100-unit plant Average unit cost of output 200-unit plant 400-unit plant 300-unit plant Volume ....
The Experience Curve Cost or price per unit Total accumulated production of units ....
Capacity Utilization Rate Defined • Cap utilization Rate = Cap. Used / Best Optg Level
How to Plan for Long-Term Capacity Flexibility • Flexible plants - minimal changeover time between product lines. • Flexible processes - flexible manufacturing systems and easy setup of manufacturing equipment; able to realize economies of scope • Flexible workers - cross training; vertical job enlargement (also called job enrichment as opposed to job enlargement).
Strategic Capacity Planning Decisions continued .. • Frequency of Capacity Additions - need balance between frequent and infrequent capacity additions • External Sources of Capacity - possible in manufacturing (e.g. chemicals and energy) but easier in service industries (e.g. banking, airline, healthcare).
Determining Capacity Requirements Steps ... • Forecast sales within each individual product line • Calculate equipment and labor requirements to meet the forecasts • Project equipment and labor availability over the planning horizon ....
Example--Capacity Requirements A manufacturer produces two lines of ketchup, FancyFine and a Generic line. Each is sold in small and family-size plastic bottles – differentiator here, is size of bottles. The following table shows forecast demand for the next four years. ....
The Product from a Capacity Viewpoint • Are we really producing two different types of ketchup from the standpoint of capacity requirements - (if the two brands are manufactured on same identical production lines)? ....
Equipment and Labor Requirements Three 100,000-units-per-year machines are available for small-bottle production. Two operators required per machine. Two 120,000-units-per-year machines are available for family-sized-bottle production. Three operators required per machine. ....
Capabilities and the Location Decision • Often driven by short-term considerations • wage rates • exchange rates • Better approach is to consider how location impacts development of long-term capabilities
Long-term Capacity Location: Six Step Process • Identify Sources of Value • Identify Capabilities Needed • Assess Implications of Location Decision on Development of Capabilities • Identify Potential Locations • Evaluate Locations • Develop Strategy for Building Network of Locations
Stage 1: Regional-International • Minimize transportation costs and provide acceptable service • Proper supply of labor • Wage rates • Unions (right-to-work laws) • Regional taxes, regulations, trade barriers • Political stability
Stage 2: Community • Availability of acceptable sites • Local government attitudes • Regulations, zoning, taxes, labor supply • Tax Incentives • Community’s attitude • Amenities
Locating Pure Service Organizations • Recipient to Facility • facility utilization • travel distance per citizen • travel distance per visit • Facility to Recipient
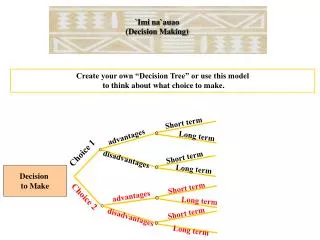
Tools for Location Decisions: Decision Trees A glass factory specializing in crystal is experiencing a substantial backlog, and the firm's management is considering three courses of action: A) Arrange for subcontracting, B) Construct new facilities. C) Do nothing (no change) The correct choice depends largely upon demand, which may be low, medium, or high. By consensus, management ranks the respective probabilities as .10, .50, and .40. A cost analysis that reveals the effects upon costs is shown in the following table. ....
Payoff Table ....
We start with our decisions... A B C ....
Then add our possible states of nature, probabilities, and payoffs $90k High demand (.4) $50k Medium demand (.5) $10k Low demand (.1) A $200k High demand (.4) $25k B Medium demand (.5) -$120k Low demand (.1) C $60k High demand (.4) $40k Medium demand (.5) $20k Low demand (.1) ....
Determine the expected value of each decision High demand (.4) Medium demand (.5) Low demand (.1) $90k $50k $62k $10k A EVA=.4(90)+.5(50)+.1(10)=$62k Exercise: Complete the decision tree analysis. ....
Planning Service Capacity • Time - capacity cannot be stored. • Location - near customer • Volatility of Demand- much higher and difficult to plan for; e.g. how do restaurants and airlines plan for this?
Capacity Utilization & Service Quality • Best operating point is near 70% of capacity • From 70% to 100% of service capacity (also called critical zones), what do you think happens to service quality? Why? • Context specific tradeoff - predictable services(e.g. commuter trains, mail sorting operations) should plan for 100% utilization rate while higher risk services (hospitals emergencies, fire services) should expect lower operating utilization rates.
Capacity Expansion Strategies:Entrepreneurial Stage • Shift resources to different tasks as needed • Customer co-production - self-serve stands for all or some food items
Capacity Expansion Strategies: Multi-site Rationalization Stage • Add services to existing site • Duplicate existing services at additional sites • Do both ....
Capacity Expansion Strategies: Growth Stage • “Bermuda Triangle” of operational complexity • Management difficulty exceeds management ability • New capacity management challenges • Need for fresh ideas • Need to upgrade older facilities ....
Capacity Expansion Strategies: Maturity Stage • Focus on operational efficiencies • Remodeling and replacement • Service modification • Duplication across entire service system ....
Learning Curves • Underlying Principles of Learning Curves • Plotting Learning Curves • Learning • From Learning Curves to Performance Improvement 2
Underlying Principles of Learning Curves 1. Each time you perform a task it takes less time than the last time you performed the same task 2. The extent of task time decreases over time 3. The reduction in time will follow a predictable pattern 3
Learning Curves • % learning Rate(90% , 80%) - is used to denote a given exponential Learning Curve(L.C.) • Yx = Kxn • Y = hrs. to produce x unit; K = hrs to produce unit 1 • x = Unit number • n = log b/log 2 where b = learning percent • logarithmic plot,.
Organizational learning - Differences in Performance (L.C.) due to • position on the curve • employee involvement in operations improvement activities (cost, quality, etc.) • existence of standards
Plotting Learning Curves Initial Manufacturing Cost: $100/unit 90% Learning Curve: 4
Plotting Learning Curves 100 90 80 90 % Learning Curve 70 60 50 Production Cost ($) 40 30 20 10 0 1 3 5 7 9 11 13 15 17 19 21 23 25 27 29 31 33 35 37 39 Unit number 5
Learning • Individual Learning • Organizational Learning 6
From Learning Curves to Performance Improvement • Proper selection of workers. • Proper training. • Motivation. • Work specialization. • Do one or very few jobs at a time. • Provide quick and easy access for help. • Allow workers to help redesign their tasks. 7
Estimating Learning Curves • Before start of production run, use: • industry standard; paying attention to differences and/or similarities in startup costs • Limited Start-up • use simple exponential curve e.g. labor for unit two/labor for unit one • With Historical data - production • use statistical analysis; plot data on log/log graph and determine LC with regression analysis or other curve fitting methodology.
Efficiency and Output Increase when Machines are Being Added
The Theory of Constraints • Balance the flows not capacities throughout the shop • The utilization of a nonbottleneck is determined by other constraints in the system, such as the bottlenecks • Utilization is not the same as activation • An hour lost at a bottleneck is an hour lost for the whole shop