Download
1 / 71
770 likes | 1.27k Views
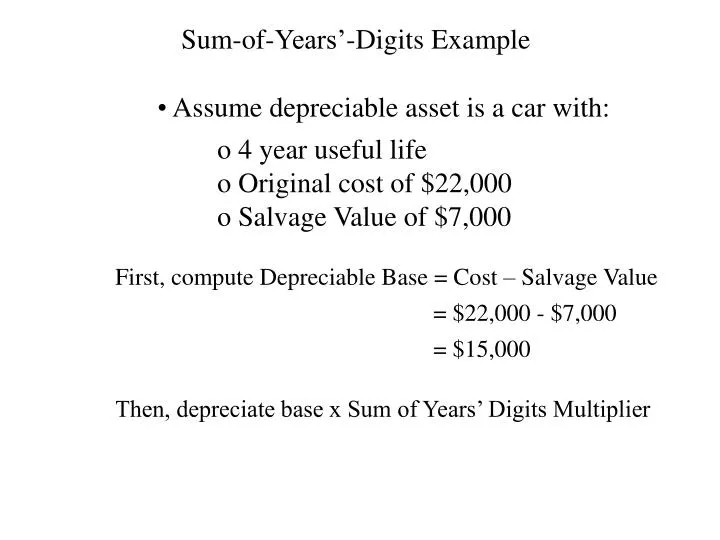
Sum-of-Years’-Digits Example. Assume depreciable asset is a car with:. 4 year useful life Original cost of $22,000 Salvage Value of $7,000. First, compute Depreciable Base = Cost – Salvage Value. = $22,000 - $7,000. = $15,000. Then, depreciate base x Sum of Years’ Digits Multiplier.

E N D
Sum-of-Years’-Digits Example • Assume depreciable asset is a car with: • 4 year useful life • Original cost of $22,000 • Salvage Value of $7,000 First, compute Depreciable Base = Cost – Salvage Value = $22,000 - $7,000 = $15,000 Then, depreciate base x Sum of Years’ Digits Multiplier
Sum-of-Years’-Digits Example Sum of Year’s Digits
Sum-of-Years’-Digits Example This was corrected on July 16, 2002. Depr. Fraction = Remaining Life/Sum of Years’ Digits
Sum-of-Years’-Digits Example This was corrected on July 16, 2002.
Sum-of-Years’-Digits Example This was corrected on July 16, 2002.
Sum-of-Years’-Digits Example This was corrected on July 16, 2002.
Sum-of-Years’-Digits Example This was corrected on July 16, 2002.
Double Declining Balance Example • Assume depreciable asset is a car with: • 4 year useful life • Original cost of $22,000 • Salvage Value of $7,000
Double Declining Balance Example Straight Line %age = 100%/Useful Life
Double Declining Balance Example Start with cost (not cost – salvage value)
Double Declining Balance Example Too much depreciation—below salvage value!
Double Declining Balance Example Throw out these final year computed values.
Double Declining Balance Example Make this enough to arrive exactly at ending salvage value.
Double Declining Balance Example Note that depreciation is complete after two years even though asset has four year useful life.
Partial Period Depreciation Note that the prior examples assumed that the assets were put in use on January 1st of the year they were bought for use. Therefore, we took a full first year of depreciation expense. In reality, assets are usually put into use at all times throughout the year. So, we need to prorate the first year’s depreciation expense and adjust the following years’ depreciation expense accordingly.
Partial Period Depreciation This is easy to do with straight-line: JoePa bought a car for $20,000, 4 yr. life, $4,000 salvage value. He started driving the car on July 1. Normal annual depreciation = $16,000 / 4 = $4,000 per year Year 1 use = 6 months/12 months = ½ year
Partial Period Depreciation This is easy to do with straight-line: JoePa bought a car for $20,000, 4 yr. life, $4,000 salvage value. He started driving the car on July 1. Normal annual depreciation = $16,000 / 4 = $4,000 per year
Partial Period Depreciation This is easy to do with straight-line: JoePa bought a car for $20,000, 4 yr. life, $4,000 salvage value. He started driving the car on July 1. Normal annual depreciation = $16,000 / 4 = $4,000 per year
Partial Period Depreciation This is easy to do with straight-line: JoePa bought a car for $20,000, 4 yr. life, $4,000 salvage value. He started driving the car on July 1. Normal annual depreciation = $16,000 / 4 = $4,000 per year
Partial Period Depreciation This is easy to do with straight-line: JoePa bought a car for $20,000, 4 yr. life, $4,000 salvage value. He started driving the car on July 1. Normal annual depreciation = $16,000 / 4 = $4,000 per year
Partial Period Depreciation This is easy to do with straight-line: JoePa bought a car for $20,000, 4 yr. life, $4,000 salvage value. He started driving the car on July 1. Normal annual depreciation = $16,000 / 4 = $4,000 per year
Partial Period Depreciation This is easy to do with straight-line: JoePa bought a car for $20,000, 4 yr. life, $4,000 salvage value. He started driving the car on July 1. Normal annual depreciation = $16,000 / 4 = $4,000 per year
Partial Period Depreciation This is harder to do with accelerated (Sum-of-Year’s Digits or Double-Declining Balance): The idea for prorating in a partial period asset placement is the same regardless of the method used for accelerated depreciation.
Partial Period Depreciation This is harder to do with accelerated (Sum-of-Year’s Digits or Double-Declining Balance): First, compute normal annual depreciation as if the asset were used the entire year. Example: JoePa bought a car for $20,000, 4 yr. life, $4,000 salvage value. He started driving the car on July 1. He uses double-declining balance method.
Partial Period Depreciation Example: JoePa bought a car for $20,000, 4 yr. life, $4,000 salvage value. He started driving the car on July 1. He uses double-declining balance method.
Partial Period Depreciation Example: JoePa bought a car for $20,000, 4 yr. life, $4,000 salvage value. He started driving the car on July 1. He uses double-declining balance method.
Partial Period Depreciation Example: JoePa bought a car for $20,000, 4 yr. life, $4,000 salvage value. He started driving the car on July 1. He uses double-declining balance method.
Partial Period Depreciation Example: JoePa bought a car for $20,000, 4 yr. life, $4,000 salvage value. He started driving the car on July 1. He uses double-declining balance method. Since the car was place in service for only ½ the first year, we need to prorate and adjust the depreciation schedule. We effectively do this by taking ½ the first year’s depreciation, and then rolling the rest of the depreciation schedule forward.
Partial Period Depreciation Example: JoePa bought a car for $20,000, 4 yr. life, $4,000 salvage value. He started driving the car on July 1. He uses double-declining balance method. Normal Schedule ½ Use First Year Schedule
Partial Period Depreciation First, take ½ of the first year’s normal depreciation. Normal Schedule ½ Use First Year Schedule x 1/2
Partial Period Depreciation First, take ½ of the first year’s normal depreciation. Then roll forward the second ½ of the first year’s normal depreciation. Normal Schedule ½ Use First Year Schedule x 1/2
Partial Period Depreciation Then add ½ of the second year’s normal depreciation to the roll forward amount. Normal Schedule ½ Use First Year Schedule x 1/2
Partial Period Depreciation Then add ½ of the second year’s normal depreciation to the roll forward amount. Normal Schedule ½ Use First Year Schedule
Partial Period Depreciation Then roll forward ½ of the second year’s normal depreciation to the third year schedule. Normal Schedule ½ Use First Year Schedule x 1/2
Partial Period Depreciation Then add ½ of the third year’s normal depreciation to the roll forward amount. Normal Schedule ½ Use First Year Schedule x 1/2
Partial Period Depreciation Then add ½ of the third year’s normal depreciation to the roll forward amount. Normal Schedule ½ Use First Year Schedule
Partial Period Depreciation Finally, roll forward ½ of the third year’s normal depreciation to the fourth year schedule. Normal Schedule ½ Use First Year Schedule x 1/2
Yr 1 Yr 2 Yr 3 Yr 4 Partial Period Depreciation Another way to look at it conceptually is with a timeline.
Yr 1 Yr 2 Yr 3 Yr 4 Partial Period Depreciation Another way to look at it conceptually is with a timeline. $10,000 $5,000 $1,000
Yr 1 Yr 2 Yr 3 Yr 4 Partial Period Depreciation Another way to look at it conceptually is with a timeline. $10,000 $5,000 $1,000 $5,000 $5,000
Yr 1 Yr 1 Yr 2 Yr 2 Yr 3 Yr 3 Yr 4 Yr 4 Partial Period Depreciation Another way to look at it conceptually is with a timeline. $10,000 $5,000 $1,000 $5,000 $5,000
Yr 1 Yr 1 Yr 2 Yr 2 Yr 3 Yr 3 Yr 4 Yr 4 Partial Period Depreciation Another way to look at it conceptually is with a timeline. $10,000 $5,000 $1,000 $5,000 $5,000 $5,000
Yr 1 Yr 1 Yr 2 Yr 2 Yr 3 Yr 3 Yr 4 Yr 4 Partial Period Depreciation Another way to look at it conceptually is with a timeline. $10,000 $5,000 $1,000 $5,000 $5,000 $5,000 $5,000
Yr 1 Yr 1 Yr 2 Yr 2 Yr 3 Yr 3 Yr 4 Yr 4 Partial Period Depreciation Another way to look at it conceptually is with a timeline. $10,000 $5,000 $1,000 $2,500 $2,500 $5,000 $5,000
Yr 1 Yr 1 Yr 2 Yr 2 Yr 3 Yr 3 Yr 4 Yr 4 Partial Period Depreciation Another way to look at it conceptually is with a timeline. $10,000 $5,000 $1,000 $2,500 $2,500 $5,000 $5,000 $2,500 $2,500
Yr 1 Yr 1 Yr 2 Yr 2 Yr 3 Yr 3 Yr 4 Yr 4 Partial Period Depreciation Another way to look at it conceptually is with a timeline. $10,000 $5,000 $1,000 $2,500 $2,500 $5,000 $5,000 $2,500 $2,500 $7,500
Yr 1 Yr 1 Yr 2 Yr 2 Yr 3 Yr 3 Yr 4 Yr 4 Partial Period Depreciation Another way to look at it conceptually is with a timeline. $10,000 $5,000 $1,000 $500 $500 $5,000 $7,500 $2,500