Download
1 / 17
170 likes | 296 Views
Learn to measure position with percentiles, interpret graphs, transform data, and define density curves in statistical distributions.

E N D
Section 2.1Describing Location in a Distribution Mrs. Daniel AP Statistics
Section 2.1Describing Location in a Distribution After this section, you should be able to… • MEASURE position using percentiles • INTERPRET cumulative relative frequency graphs • TRANSFORM data • DEFINE and DESCRIBE density curves
Measuring Position: Percentiles • One way to describe the location of a value in a distribution is to tell what percent of observations are less than it. • The pth percentile of a distribution is the value with p percent of the observations less than it.
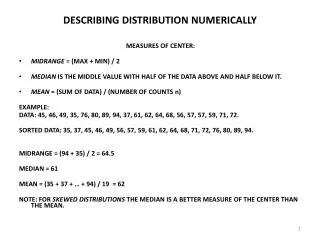
Jenny earned a score of 86 on her test. How did she perform relative to the rest of the class? What percentile is she ranked in? 6 7 7 2334 7 5777899 8 00123334 8 569 9 03
6 7 7 2334 7 5777899 8 00123334 8 569 9 03 Her score was greater than 21 of the 25 observations. Since 21 of the 25, or 84%, of the scores are below hers, Jenny is at the 84th percentile in the class’s test score distribution. Jenny earned a score of 86 on her test. How did she perform relative to the rest of the class? What percentile is she ranked in? 6 7 7 2334 7 5777899 8 00123334 8 569 9 03
Cumulative Relative Frequency Graphs A cumulative relative frequency graph displays the cumulative relative frequency of each class of a frequency distribution.
1. Was Barack Obama, who was inaugurated at age 47, unusually young? 2. Estimate and interpret the 65th percentile of the distribution 65 11 58 47
Transforming Data • Transforming converts the original observations from the original units of measurements to another scale. • Some transformations can affect the shape, center, and spread of a distribution.
Transforming Data: Add/Sub a Constant • Adding the same number a (either positive, zero, or negative) to each observation: • adds a to measures of center and location (mean, median, quartiles, percentiles), but • Does not change the shape of the distribution or measures of spread (range, IQR, standard deviation).
Transforming Data: Multiplying/Dividing • Multiplying (or dividing) each observation by the same number b (positive, negative, or zero): • multiplies (divides) measures of center and location by b • multiplies (divides) measures of spread by |b| • does not change the shape of the distribution
Transforming Data Change data from feet to meters
Density Curve • A density curve: • is always on or above the horizontal axis, and • has area exactly 1 underneath it. • A density curve describes the overall pattern of a distribution. • The area under the curve and above any interval of values on the horizontal axis is the proportion of all observations that fall in that interval. The overall pattern of this histogram of the scores of all 947 seventh-grade students in Gary, Indiana, on the vocabulary part of the Iowa Test of Basic Skills (ITBS) can be described by a smooth curve drawn through the tops of the bars.
Describing Density Curves The median and the mean are the same for a symmetric density curve. They both lie at the center of the curve. The mean of a skewed curve is pulled away from the median in the direction of the long tail.