Download

1 / 16
180 likes | 357 Views
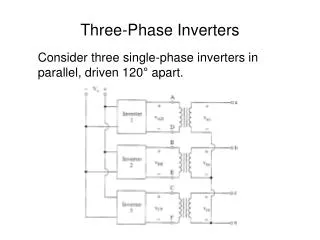
Three-Phase Measurements of Non-Wetting Phase Trapping Applied to Carbon Dioxide Storage. Saleh K Al-Mansoori, Stefan Iglauer, Christopher H Pentland, Martin J Blunt. Background. Three-Phase Flow in Literature:.

E N D
Three-Phase Measurements of Non-Wetting Phase Trapping Applied to Carbon Dioxide Storage Saleh K Al-Mansoori, Stefan Iglauer, Christopher H Pentland, Martin J Blunt
Background Three-Phase Flow in Literature: • Studied extensively to measure the amount of residual gas saturation during reservoir displacements. • Suggested low oil saturations during gas displacement (oil layers). • Trapping experience: experimentally on water-wet consolidated media. • Pervious work: • a linked the reduction ofSor to Sgt, a = 0 – 1, (a = 0 oil-wet, 0.45 - 0.75 water-wet) • Showed:
Motivation • Principal interest: gas and oil trapping by water with application to CO2 storage Unconsolidated media • Literature data for trapped gas saturation in consolidated systems.
Motivation • Wide scatter in literature S(nw)i versus S(nw)r data. • Trapping Capacity = f S(nw)r
Experimental Set Up • Wetting phase – Brine (5wt% NaCl; 1wt% KCl) • Non-wetting phase – n-octane and air • Oil and brine rate= 5 mL/min (Ncap=10-5, 2x10⁻⁵) • Air injection rate = drainage gravity (different amounts of time) • Saturated air with octane for 5 hours • Controlled evaporation using long, narrow tube
Oil-gas-brine experiments - Experimental Procedure • Pack column with sand • Packing ratio used to give reproducible porosity • Fully saturate column with brine (vertically) • Fixed volume of brine and oil injected into the column (500 mL) • Air enters from the top, oil and gas drain from bottom (gravity drainage) • Column is left to drain for different amounts of time (17h, 2h, and 0.5h). • Column is sliced for Sgi/Soi or waterflooded to reach Sgr/Sor. • Column is sliced and sampled. Analysis of saturations in each section done with gas chromatography, GC & mass balance. • Thermal Conductivity Detector (TCD) allows water to be analysed • Sand is carefully recovered and washed with de-ionized water, dry mass of sand is measured, weighed and measured VB each empty clean column section. • Repeat (reproducibility)
Experimental Results: gravity drainage: 17 hour Results: Saturation profiles Initials: Swi/Soi/Sgi saturation curves Residuals: Sw/Sor/Sgr saturation curves– post waterflooding
Experimental Results: gravity drainage: 17 hour Results: Trapping curves • Sgr Vs. Sgi • Sor Vs. Soi • Sor Vs. Sgi • Sor Vs. Sgr • Sgt Vs. Snr • Snr Vs. Sni
Experimental Results: gravity drainage: 2 hour Results: Results: Saturation profiles Initials: Swi/Soi/Sgi saturation curves Residuals: Sw/Sor/Sgr saturation curves– post waterflooding
Experimental Results: gravity drainage: 2 hour Results: Results: Trapping curves • Sgr Vs. Sgi • Sor Vs. Soi • Sor Vs. Sgi • Sor Vs. Sgr • Sgt Vs. Snr • Snr Vs. Sni
Experimental Results: gravity drainage: 0.5 hour Results: Saturation profiles Initials: Swi/Soi/Sgi saturation curves Residuals: Sw/Sor/Sgr saturation curves– post waterflooding
Experimental Results: gravity drainage: 0.5 hour Results: Trapping curves • Sgr Vs. Sgi • Sor Vs. Soi • Sor Vs. Sgi • Sor Vs. Sgr • Sgt Vs. Snr • Snr Vs. Sni
Experimental Results: experiments 1-3 Results: Trapping curves • Compiled Sgr vs. Sgi b. Compiled Sor vs. Soi
Discussion and conclusions For high initial gas saturation, more gas is trapped in the presence of oil than in two-phase flow. The trapped oil saturation, while no higher than the maximum reached in two-phase flow, is higher than expected for low initial saturations. Different from results in consolidated media. Why? In unconsolidated media, in two-phase flow, there is little snap-off and hence little trapping. In three-phase flow, oil layer collapse traps oil easily. Trapped oil prevents direct contact of gas by water except by snap-off and so we see more trapping. Confirm this? Pore-scale modelling; further experiment at reservoir conditions and with consolidated media.
Acknowledgements • ADNOC • Shell-Imperial Grand Challenge on Clean Fossil Fuels Thank you!