Download
1 / 18
200 likes | 462 Views
Linear Regression on the Calculator. Please view this tutorial and answer the follow-up questions on loose leaf to turn in to your teacher. What is Linear Regression?. Linear regression is also known as “line of best fit” You can estimate it by hand using a scatterplot and a ruler

E N D
Linear Regression on the Calculator Please view this tutorial and answer the follow-up questions on loose leaf to turn in to your teacher.
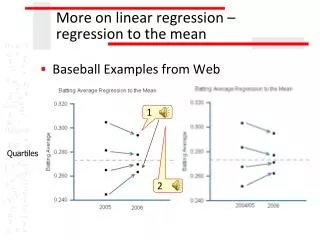
What is Linear Regression? • Linear regression is also known as “line of best fit” • You can estimate it by hand using a scatterplot and a ruler • You can get the exact line of best fit by using the LinReg function on your calculator
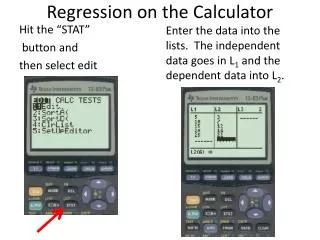
Steps for Finding Linear Regression on the Calculator • Enter your information in a list • Quit your lists • Find the linear regression line by going to STAT then CALC then 8:LinReg(a+bx) then hit ENTER • Tell your calculator where the information is (Ex. L1, L2) • Hit ENTER and plug in your values for a and b (Round values for a and b to 2 decimal places.)
Example The table to the left gives the average income for different medical specialties for 1988 and 1994.
Example First, you’ll need to enter your information into a list. Put the Income in 1988 in L1 and the Income in 1994 in L2 then quit your lists.
Example Next, you need to hit STAT then go over to CALC. Then go down to 8:LinReg(a+bx) and hit ENTER.
Example You’ll see this screen. You need to tell the calculator where your information is. In this case, the x information is in L1 and the y information is L2.
Example Hit 2nd 1 then Comma (above the 7) then 2nd 2. Hit ENTER. You’ll see the values for a and b.
Example Now all you need to do to find your line of best fit is plug in your values for a and b to the general equation for the line. Don’t forget to round values for a and b to TWO decimal places!
Example a = -2525.06 b = 1.66 Since the general form of the equation is y = a + bx, a is your y-interecept and b is your slope. So the equation of the line is:
Example How can we check that this line is a good fit? Make a scatterplot of the information on the calculator then graph the y= equation.
Example Check to see if the line touches some points, has some points above it and some points below it. This line is a great fit!
Example For example, our problem was talking about income in 1988 versus the income in 1994. Once you have your line of best fit, you can use it to make estimations. If you earned $120,000 in 1988, how much could you expect to earn in 1994?
Example Type your equation in y= then find $120,000 in your x column by changing your TblStart to 120,000. If you made $120,000 in 1988, you can expect to earn $196,675 in 1994.
Follow-Up Questions Answer the following questions on loose leaf and hand them in to your teacher.
Follow-Up Questions Here are the prices for different Nintendo game systems when they were first released. Answer the following questions based on this information.
Follow-Up Questions NOTE: When entering the years in your list, change them to YEARS SINCE 1985. For example, 1991 would be entered as 6 since it is 6 years since 1985.
Follow-Up Questions Write the linear regression line for the Nintendo information. What is the slope? What is the y-intercept? Using your linear regression line, estimate the price of a new system if it were released in 2011. In what year will the price of a newly released system be $277?