Visualizing Thread Behavior in Java Programs: A Comprehensive Tool for Debugging
We introduce TIV (Thread Interaction Viewer), a tool designed to visualize and analyze thread behavior in large, long-running Java applications. TIV features three interactive views: a Timeline View for tracking individual thread actions over time, Interaction View for revealing contending threads, and a 3-D View for detailed data analysis. This advanced visualization framework enhances error identification, improves understanding of thread interactions, and facilitates debugging by tailoring data representation to different program scales. Streamline your programming workflow with TIV.

Visualizing Thread Behavior in Java Programs: A Comprehensive Tool for Debugging
E N D
Presentation Transcript
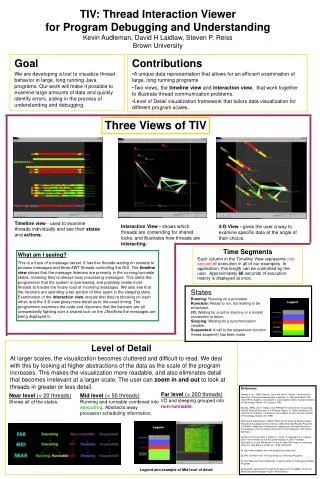
Timeline view - used to examine threads individually and see their states and actions. Interaction View - shows which threads are contending for shared locks, and illustrates how threads are interacting. States Running: Running on a processor Runnable: Ready to run, but waiting to be scheduled. I/O: Waiting for a call to memory or a socket connection to return. Sleeping: Waiting for a synchronization variable. Suspended: A call to the suspension function thread.suspend() has been made. 3-D View - gives the user a way to examine specific data at the angle of their choice. Goal We are developing a tool to visualize thread behavior in large, long running Java programs. Our work will make it possible to examine large amounts of data and quickly identify errors, aiding in the process of understanding and debugging. • Contributions • A unique data representation that allows for an efficient examination of large, long running programs • Two views, the timeline view and interaction view, that work together to illustrate thread communication problems. • Level of Detail visualization framework that tailors data visualization for different program scales. TIV: Thread Interaction Viewer for Program Debugging and UnderstandingKevin Audleman, David H Laidlaw, Steven P. ReissBrown University Three Views of TIV What am I seeing? This is a trace of a message server. It has five threads waiting on sockets to process messages and three AWT threads controlling the GUI. The timeline view shows that the message listeners are primarily in the running/runnable states, meaning they’re always busy processing messages. This alerts the programmer that the system is overloaded, and probably needs more threads to handle the heavy load of incoming messages. We also see that the listeners are spending a fair portion of time spent in the sleeping state. Examination of the interaction view reveals that they’re blocking on each other, and the 3-D view gives more detail as to the exact timing. The programmer examines the code and discovers that the listeners are all unexpectedly fighting over a shared lock on the JTextArea the messages are being displayed in. Time Segments Each column in the Timeline View represents one second of execution in all of our examples. In application, this length can be controlled by the user. Approximately 60 seconds of execution history is displayed at once. Level of Detail At larger scales, the visualization becomes cluttered and difficult to read. We deal with this by looking at higher abstractions of the data as the scale of the program increases. This makes the visualization more readable, and also eliminates detail that becomes irrelevant at a larger scale.The user can zoom in and out to look at threads in greater or less detail. References [Stasko et. al., 1995] Qiang A. Zhao and John T. Stasko, Visualizing the execution of threads-based parallel programs. In Technical Report GIT-GVU-95/01, Graphics, Visualization, and Usability Center, Georgia Institute of Technology, Atlanta, GA, January 1995. [Stasko, 1995] John T. Stasko, The PARADE Environment for Visualizing Parallel Program Executions: A Progress Report. In Technical Report GIT-GVU-95-03, Graphics, Visalization, and Usability Center, Georgia Institute of Technology, Atlanta, GA, 1995. [Stein and Kergommeaux 1997] B. Stein and Chassin de Kergommeaux, Interactive Visualization Environment of Multi-threaded Parallel Programs. In Parallel Computing: Fundamentals, Applications and New Directions, Proceedings of the Conference ParCo'97, 19-22 September 1997, Bonn, Germany. [Guitart and Torres 2000] J. Guitart, J. Torres, E. Ayguad and J. Labarta. Java Instrumentation Suite: Accurate Analysis of Java Threaded Applications. In 2nd Workshop on Java for High Performance Computing, Santa Fe, New Mexico (USA), pp. 15-25. May 2000. [5] http://www.research.ibm.com/jinsight/docs/index.htm [6] Wim De Pauw et al, Drive-by Analysis of Running Programs [7] John May and Francine Berman, Creating Views for Debugging Parallel Programs. [8] Bryan M. Cantrill and Thomas W. Doeppner Jr, ThreadMon: A Tool for Monitoring Multithreaded Program Performance. Far level (< 200 threads) I/O and sleeping grouped into non-runnable. Near level (< 20 threads) Shows all of the states. Mid level (< 50 threads) Running and runnable combined into executing. Abstracts away processor scheduling information. Legend and example of Mid level of detail