Download
1 / 55
550 likes | 663 Views
Reduce Monthly Natural Gas Consumption. Group Members: - Seyed Alireza Tabatabaei - - - -. May 2010. Define. Answer These Q’s in Define Phase. What is the problem being addressed? Who is the customer? What are the business reasons for completing this project?

E N D
Reduce Monthly Natural Gas Consumption Group Members: -SeyedAlirezaTabatabaei - - - - May 2010 Natural Gas Consumption
Define Answer These Q’s in Define Phase • What is the problem being addressed? • Who is the customer? • What are the business reasons for completing this project? • What is the goal of this project? • Describe the benefits of this project • Where, when and to what extent does this problem occur? • What are the boundaries of this project? • What resources will be needed for this project? • What do you need from your sponsor? team? • What data has been collected to understand customer requirements? • What criteria was used in selecting your project? What is the problem? Why Am I Doing It? Do I understand the limits?
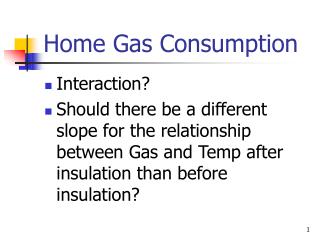
Define Y Statement • Reduce monthly natural gas consumption by 20% for the months of Dec thru Mar • Set back temperature • Insulation improvements This is a Header
Define Develop A Charter • Business Case – Why am I doing this project? • Cost savings, Carbon footprint reduction • ME 414 Class Hands on experiment • Learn 6S approach to a given goal • Learn data analysis • Schedule • Complete data collection by mid March before outside temp warms up • Complete analysis tool development during ME414 Spring 2010 semester This is a Header
Process Map Do I understand the process? What are the critical parameters? What are the failure modes? Can I measure the quantity to be improved with at least 80% confidence? DefineProcess Map
Process Map Allows people to illustrate what happens in a process Useful for clarifying the scope of a project Excellent visual aide for identifying the “hidden factory” (rework/defect prevention) Identifies all the potential inputs that may affect the key outputs of the process Everything we do is a process …some processes are straight forward …other processes can be chaotic DefineProcess Map
Types of Process Map Process Variables Map Used as the first step in the Six Sigma process (Funnel Effect) Critical to successfully improving processes by reducing and removing variation “As is/Can be” Map Excellent method for identifying non-value-added steps Necessary first step in cycle time reduction projects Other types used for specific purposes: Swim-lane, SIPOC, flow-chart, etc… DefineProcess Map
The Funneling Effect DefineProcess Map 30+ Inputs All X’s • Process Maps MEASURE 10 - 15 1st “Hit List” • C&E Matrix • Failure Modes and Effects Analysis • Multi-Vari Studies 8 - 10 ANALYZE Screened List IMPROVE • Design of Experiments (DOE) 4 - 8 Found Critical X’s CONTROL 3 - 6 • Control Plans Controlling Critical X’s Critical Input Variables
Detailed Process Map What is the tool? Graphical illustration of your process What will the tool identify? All value-added and non-value-added process steps Key Process Inputs (X’s) (KPIV) Key Process Outputs (Y’s) (KPOV) Data Collection Points When do you apply process mapping? Always What are results of Process Mapping? Identify systems needing Measurement Studies Identify KPOV’s for Capability Studies Identify missing elements in the Control Plan Identify possible non-value-added process steps DefineProcess Map
Measure Process Map • Thermostat • Set back temp? • Furnace • Energy Consumption • Gas Bill • Measurement system • Energy cost gas & electricity This is a Header
Critical Parameter Management Complete CPM
Measure Measure • MSA • Measurement system capability study • Temp sensors, A/D converters • Compare calculated degree days to published deg-days of Carmel • Inside humidity accuracy • Furnace on time estimate or measurement accuracy This is a Header
Measure Heating Degree DaysVectren Bill vs. HDD Measurements • Correlation between vectren, internet site and measured HDD days This is a Header
Measure Heating Deg Days vs. Therms Used This is a Header
Measure HDD vs. Therms Regression Analysis • Good linear correlation between Therms and heating degree days • P value is zero • 31.7 Therms at zero heating degree days • Water heater consumption is 31.7 Therms This is a Header
Measure Error AnalysisDeviation from Therms vs HDD linearity Expect to have a random error No common cause for errors Error is normally distributed Error should not have a trendNo common cause for errors This is a Header
Measure Monthly Variation of HDDJan 2007 – Jan 2010 • Months of February and November shows the most variation. • Why? This is a Header
Measure Does the Setup Measure Energy Consumption Accurately • For each of the 24 hr data set • Calculate the heater on time • Calculate heating degree days • Plot HDD vs. heater on time • Does it show a linear behavior This is a Header
Analysis • Heater on Time vs HDD ME 414 – 6S Approach
Analysis • Heater on Time vs HDD ME 414 – 6S Approach
Analysis • Heater on Time vs HDD ME 414 – 6S Approach
Analysis • Heater on Time vs HDD ME 414 – 6S Approach
Measure Heater On Time Calculation • Options to calculate heater on time • Measure register air temp with LM34 sensor or a thermistor • Heated air transport delay time between furnace and register where sensor is located • Microphone to detect air movement • Negligible air movement transport delay • Detect heater on signal from the controller • Best method for heater on time accuracy • Requires one or two more microcontroller I/O pins to pick-up the fan on and heater on signals • Communication signals are at 24V. Signal needs to be reduced to 5V before connecting to microcontroller I/O. • Thermostat to furnace communication needs to be decoded. It is a function of the thermostat brand.
Measure Relationship between Therms and Heater On Time • Convert heater on time to Therms • Furnace spec (BTU-hr, efficiency, model #) • Calculate house heat loss using the excel file • Compare calculated heat loss to Therms calculated from heater on time • Is there a good correlation between analysis and measurement?
Analysis • Therms analysis ME 414 – 6S Approach
Measurement Error • Error due to long signal wires • Filter design • Impact on mean value ME 414 – 6S Approach
Measure Temperature & Humidity Measurement System • Measurement System Components • LM34 Temperature sensor • HIH4000 Humidity sensor • LTC1298 A/D converter Room Humidity & Temperature HIH 4000 LM34 Outside Ambient Temperature HVAC Register Outlet Temp This is a Header
First Order Low Pass Filters Cut-Off Cut-Off Original Signal GreenFrom LM34 RedTo LTC 1298 (Hz) Cut-Off Ground This is a Header
Analyze Initial Capability • Initial capability • What is the current energy usage as baseline where savings will be calculated from • Degree day comparison • Past 5 to 10 years gas and electric bills (kWhr used not $$$) • Calculate heat loss from the house using the excel analysis tool • Make the tool more general to include individual rooms • Run transient heat transfer analysis using the Matlab tool and compare to measured data This is a Header
Analysis • Energy Cost Analysis ME 414 – 6S Approach
Results • The cost for one day at these temperatures is: $0.33 • The optimal day time temperature is: 51 Degrees F • The total running time per day is: 97 Minutes Jan 22nd
Results • The cost for one day at these temperatures is: $0.13 • The optimal day time temperature is: 59 Degrees F • The total running time per day is: 38 Minutes Jan 28th
Results The cost for one day at these temperatures is: $0.18 The optimal day time temperature is: 47 Degrees F The total running time per day is: 53 Minutes Jan 29th
Results Feb 3rd • The cost for one day at these temperatures is: $0.24 • The optimal day time temperature is: 48 Degrees F • The total running time per day is: 71 Minutes
Results The cost for one day at these temperatures is: $0.28 The optimal day time temperature is: 50 Degrees F The total running time per day is: 83 Minutes Feb 4th
Results The cost for one day at these temperatures is: $0.27 The optimal day time temperature is: 50 Degrees F The total running time per day is: 79 Minutes Feb 5th
Results The cost for one day at these temperatures is: $0.22 The optimal day time temperature is: 49 Degrees F The total running time per day is: 64 Minutes Feb 6th
Analyze Multi-Vari • Effect of degree days on energy used • Heat leaks from the house • Thermal survey around the windows • Window pane inside and outside temperatures • Wall inside temp of outside walls • Literature survey on set-back temperature • Furnace specifications – Energy output BTU/hr This is a Header
Analyze Setback Temperature • Faster recovery time systems will have more savings with setback • Larger AC units will have shorter on times but will remove less humidity • Effect of setback is negligible if outside temp is > 4 C • 8 hr setback period will save 1% energy per degree setback Are these statements correct? Validate with Data This is a Header
Therm, BTU, Joule & Calorie • A BTU (British Thermal Unit) is the amount of heat necessary to raise one pound of water by 1 degree Farenheit (F). • 1 British Thermal Unit (BTU) = 1055 J • 1 BTU = 252 cal = 1.055 kJ • 1 Quad = 1015 BTU (World energy usage is about 300 Quads/year, US is about 100 Quads/year in 1996.) • 1 therm = 100,000 BTU • 1,000 kWh = 3.41 million BTU • 1 calorie of heat is the amount needed to raise 1 gram of water 1 degree Centigrade. • 1 calorie (cal) = 4.184 J(The Calories in food ratings are actually kilocalories.)
Natural Gas • Energy content 1030 BTU / Cubic Foot • Pounds of CO2 per billion BTU of energy:Coal 208,000 poundsOil 164,000 poundsNatural Gas 117,000 pounds • Ratios of CO2 pollution:Oil / Natural Gas = 1.40Coal / Natural Gas = 1.78 • Pounds of CO2 per 1,000 kWh, at 100% efficiency:Coal 709 poundsOil 559 poundsNatural Gas 399 pounds
Humidity Sensor HIH4000 Datasheet This is a Header
No Power to LM34 ME 414 – 6S Approach
No Power to LM34 ME 414 – 6S Approach
5V to LM34 – No Capacitor ME 414 – 6S Approach
5V to LM34 & 33uF Capacitor ME 414 – 6S Approach
Freq Domain – 5V & 33uF ME 414 – 6S Approach
5V No Cap ME 414 – 6S Approach
5V No Cap ME 414 – 6S Approach