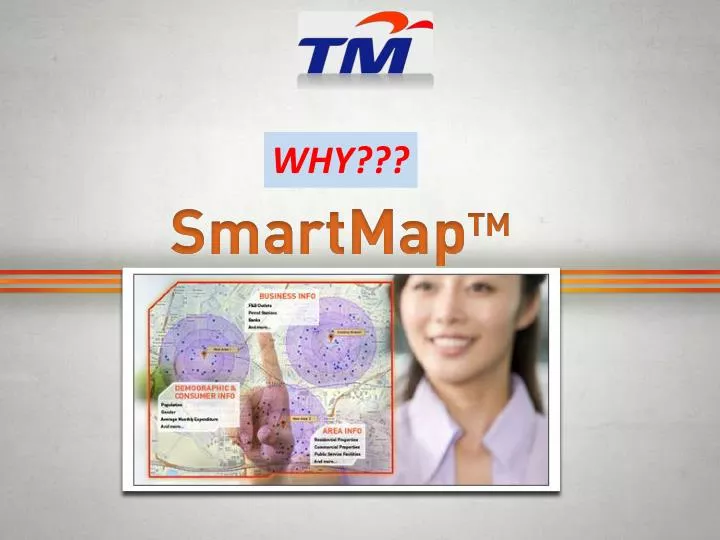

WHY???
E N D
Presentation Transcript
BACKGROUND Simple Need, lot of development Time and Resource Intensive
Obstacles : Business GIS There must be a better way
Import User Data into SmartMap • SmartMap • web based GIS application • geo spatial analysis tools • SmartMap USERS • No GIS Skill • No Programming • No investment in HW • No Investment in GIS SW • No maintenance • No data sourcing SmartMap contents SmartMap : GIS for Non-GIS Users
Building Content iProperty YP SME JUPEM Statistic Dep Local Council TM Phone Location TM Net Plan, Developer Plan ITIS/ LLM DGPS Survey Satellite Images 300 LQ Census Blk sourcing Navigation Data TM GIS Content Master feedback AVL Customers (Shell, PLUS, Logistics) GIS Customers Pizza Hut, Domino, Inti, Econsave,.. TM Staff & Family
SmartMapTM Contents Expenditure Population Satellite imagery Property value & info (iProperty) Point of Interests (Yellow Pages) Base Map Point of Interests (SME) POI + Property (TM DB)
Operation Support : Track your Asset (Location + Detail) Asset, Customer, Events (complaint, promotion,….) Create you own point, lines, polygon and attribute tables
Business Operation: Identify the road/street in an service/delivery area
Operation Support SmartMap show your service areas and asset information Zone A Branch: Bukit Jelutong Roads: 163 Delivery team: Team X Delivery time: within 1-5 mins Zone B Roads: 142 Branch: Seksyen 13 Delivery team: Team Y Delivery time: within 10 - 15 mins Zone C Branch: Seksyen 13 Roads: 185 Delivery team: Team Y Delivery time: within 6 – 10 mins Zone D Branch: Bukit Jelutong Roads: 152 Delivery team: Team X Delivery time: within 16 – 20 mins Extract roads listing: To check customer is within the service area or not.
Business Operation : Sharing Operational Data Across the Company • Different access level • Read only • Read-write only • Read-write & copy
Business Planning : Do area zoning to avoid service cannibalization
Business Planning: Analyze Economic Data Provided by TM Partners • 1km • Household: 33,000 • Property value: RM 343,000 • Business: • Fast Food: 10 • 2km • Household: 41,011 • Property value: RM 421,000 • Business: • Fast Food: 11 • 3km • Household: 67,005 • Property value: RM 360,001 • Business: • Fast Food: 23
Business Planning: Analysis of New Business Location • Proposed Site 1 • Household: 65,000 • Property value: RM 563,000 • Business: • Fast Food: 10 • Proposed Site 2 • Household: 73,511 • Property value: RM 612,120 • Business: • Fast Food: 11 • Proposed Site 3 • Household: 67,005 • Property value: RM 572,001 • Business: • Fast Food: 23
Business Planning Analyze Existing Customer Distribution, and Untapped Area 1. Discover overall market potential within service area. Potential customers Regular customers Potential customers 2. Able to identify “where is my customers” and mark them within the service area Targeted promotion: More advertisement or promotion is needed on this part of service area
Business Performance Analysis: Comparison between current vs potential customer Potential customers: 172 Existing customers: 21 Potential customers: 364 Existing customers: 31 Potential customers: 355 Existing customers: 18 Potential customers: 405 Existing customers: 5
BUSINESS PERFORMANCE ANALYSIS Smartmap generates interactive analysis map based on user’s data Branch #1: Revenue: RM120,000 Fixed Cost: RM20,000 Variable Cost: RM15,000 No of Households: 15,000 Potential revenue: 375,000 Branch #2: Revenue: RM220,000 Fixed Cost: RM40,000 Variable Cost: RM25,000 Market size: 18,700 Potential revenue: 467,500 Why is revenue high? What is business surrounding?
Business Performance Analysis Easy to Understand Performance Report Straight away identify the untapped market
CONCLUSION Business Planning FOR N0N-GIS USER Business Performance Business Operation We are about half way into development Location Asset recording & Management, Service Boundary & Delivery area, Marketing campaign, Assess your business performance against your location