Download

1 / 9
90 likes | 208 Views
This instructional guide focuses on solving and graphing inequalities in two variables. It covers fundamental rules, such as isolating 'y' when graphing. You'll learn about different types of inequalities, illustrated with examples showing how to use open and closed circles, and how to determine shading based on the inequality type—greater than or less than. The guide also addresses systems of inequalities, demonstrating how to represent multiple inequalities on a single graph. Engage in practical applications with exercises and homework to reinforce your understanding.

E N D
Solving Inequalities in 2 Variables Monday, February 10, 2014
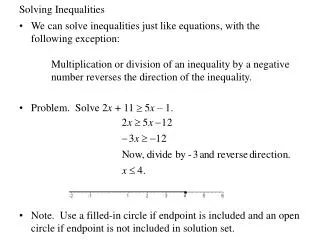
What are the rules? • How do you graph a line? • You graph an inequality basically the same way… you need to isolate y. • If it can’t be equal, it’s like a regular inequality when you graph… the open circle becomes a dotted line. • If it can be equal, then like the closed circle, your line is solid.
Let’s try graphing and solving… • Graph and pick a point. Does the point satisfy the inequality? • Do a few more. Do you see a pattern? • Are the answers above or below the line? • When?
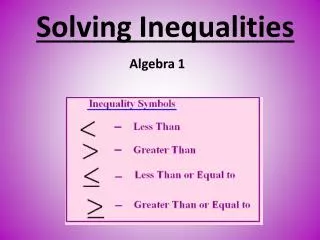
Where do you shade? • If it’s greater, shade above. • If it’s less than, shade below.
What if there is more than one inequality? • If there is more than one inequality, you have a system of inequalities. • Graph like you graph an inequality in 2 variables. • The solution for a system of inequalities is where the shading overlaps! • So, a system of inequalities has a range of solutions, not just one point. Sometimes a system has no solution.
Try it. • Using 2 different colored pencils, let’s see what happens. • Pick a color for each inequality. • Graph them on the same grid.
Homework Complete worksheet on Graphing Linear Inequalities and Solving Systems of Inequalities.
Mathalicious Lesson Datelines
Exit Ticket On a half-sheet of paper, list the rules for solving systems of inequalities.