Download

1 / 27
270 likes | 412 Views
Low-Mass Star Formation in a Small Group, L1251B. Jeong-Eun Lee UCLA. The Universe. stars. life. Galaxy. Planet. Why Star Formation?. Stars are one of the most fundamental objects in Astronomy.

E N D
Low-Mass Star Formation in a Small Group, L1251B Jeong-Eun Lee UCLA
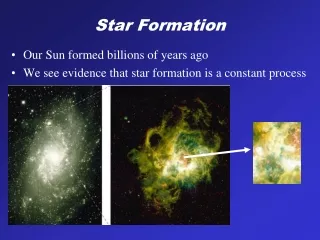
The Universe stars life Galaxy Planet Why Star Formation? • Stars are one of the most fundamental objects in Astronomy. • Understanding star formation can provide important clues for galaxy evolution, planet formation, and ultimately, the origin of life.
Questions to be answered • How do dense molecular cores start to collapse to form stars? • What are the initial conditions of the collapse? • How is chemical evolution in molecular cores linked to their dynamical evolution? • How do the chemical changes affect the formation of planets and life?
How to answer those questions? • Study more isolated low mass cores less complicated and easier to interpret observations • Combination of continuum and line observations to provide a coherent, self-consistent picture of YSOs and their associated, gaseous environments (n, T, v)
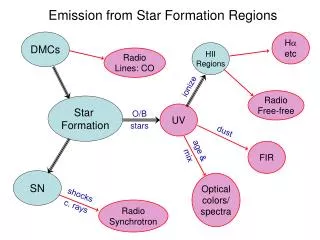
Observations in L1251B • Continuum 2MASS, IRAC & MIPS(SST), SHARC (CSO), SCUBA (JCMT), MAMBO (IRAM), OVRO, SMA • Molecular Lines FCRAO: CS 2-1, HCO+ 1-0, H13CO+ 1-0, N2H+ 1-0, HCN 1-0 CSO: CO 2-1, HCO+ 3-2, DCO+ 3-2 OVRO: N2H+ 1-0, HCO+ 1-0, H2CO 312-211 SMA: CO 2-1, 13CO 2-1, C18O 2-1, N2D+ 3-2 ARO (NRAO): CS 3-2, 5-4
L1251 (Sato et al. 1994) IRAS 22376+7455
SCUBA 850 μm and MIPS 24 μm IRAS 22376+7455
IRAC 3.6, 4.5, & 8.0 μm HH 373 IRAS 22376+7455 UGC 12160
L1251B IRAS 22376+7455
1,2,4,16 3,5,6,8,9 7,10,12,13,14 Only 1, 2, and 4 have been detected in MIPS 24 μm. IRAC Color-Color Diagram
Submillimeter Continuum gray: K-band contours: submm Thermally heated 350 μm 450 μm Column density peak 850 μm 1300 μm
OVRO Continuum Observations(disk component) IRS3 IRS4 IRS1 IRS2 gray: 4.5 µm contours: 3.4 mm gray: 1.3 mm contours: 3.4 mm
SMA Continuum Observations gray: 4.5 µm contours: 1.3 mm IRS6 IRS3 Prestellar condensations? IRS4 IRS5 IRS1 IRS2
L1251B is a small group of pre- and protostellar objects. • In L1251B, six sources were detected in all IRAC bands. Half of them were classified as Class 0/I candidates, and the other half were classified as Class II candidates. • Dust continuum emission maps at 350 and 450 µm have two intensity peaks. The weaker peak is associated with IRS1, but the stronger peak is located between IRS1 and IRS2. The stronger peak has been resolved to two sources (prestellar objects) in the SMA 1.3 mm.
Outflow in CSO CO 2-1 and OVRO HCO+ 1-0 CO 2-1 blue component K band&HCO+ 1-0 1 2 1 4 red component 2
Thick contours: N2H+ Thin contours: HCO+ Gray: 3 mm continuum Contours: H2CO Gray: 1 mm continuum P-V diagram OVRO Line Observations 1 4 1 2
SMA Line Observations 4 1 2
A possible formation model of L1251B blue red blue red
L1251B probably formed through collapse of a rapidly rotating core. • Infall signature was detected in optically thick lines, and velocity gradients, indicative of rotation, were measured. • The large molecular outflow structure may be the accumulated result of multiple outflows, and IRS4 is possibly triggered to form by the outflow from IRS1.