Download
1 / 30
310 likes | 414 Views
Summarizing Variation Matrix Algebra & Mx. Michael C Neale PhD Virginia Institute for Psychiatric and Behavioral Genetics Virginia Commonwealth University 19 th International workshop on Methodology Twin and Family Studies. Overview. Mean/Variance/Covariance Calculating Estimating by ML

E N D
Summarizing VariationMatrix Algebra & Mx Michael C Neale PhDVirginia Institute for Psychiatric and Behavioral GeneticsVirginia Commonwealth University19th International workshop on Methodology Twin and Family Studies
Overview • Mean/Variance/Covariance • Calculating • Estimating by ML • Matrix Algebra • Normal Likelihood Theory • Mx script language
Computing Mean • Formula E(xi)/N • Can compute with • Pencil • Calculator • SAS • SPSS • Mx
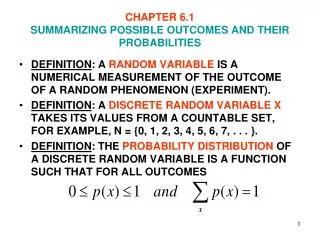
One Coin toss 2 outcomes Probability 0.6 0.5 0.4 0.3 0.2 0.1 0 Heads Tails Outcome
Two Coin toss 3 outcomes Probability 0.6 0.5 0.4 0.3 0.2 0.1 0 HH HT/TH TT Outcome
Four Coin toss 5 outcomes Probability 0.4 0.3 0.2 0.1 0 HHHH HHHT HHTT HTTT TTTT Outcome
Ten Coin toss 9 outcomes Probability 0.3 0.25 0.2 0.15 0.1 0.05 0 Outcome
Fort Knox Toss Infinite outcomes 0.5 0.4 0.3 0.2 0.1 0 -4 -3 -2 -1 0 1 2 3 4 Heads-Tails De Moivre 1733 Gauss 1827
Dinosaur (of a) Joke • Elk: The Theory by A. Elk brackets Miss brackets. My theory is along the following lines. • Host: Oh God. • Elk: All brontosauruses are thin at one end, much MUCH thicker in the middle, and then thin again at the far end.
Pascal's Triangle Probability Frequency 1 1 1 1 2 1 1 3 3 1 1 4 6 4 1 1 5 10 10 5 1 1 6 15 20 15 6 1 1 7 21 35 35 21 7 1 1/1 1/2 1/4 1/8 1/16 1/32 1/64 1/128 Pascal's friend Chevalier de Mere 1654; Huygens 1657; Cardan 1501-1576
Variance • Measure of Spread • Easily calculated • Individual differences
Average squared deviation Normal distribution : xi di -3 -2 -1 0 1 2 3 Variance =Gdi2/N
Measuring Variation Weighs & Means • Absolute differences? • Squared differences? • Absolute cubed? • Squared squared?
Measuring Variation Ways & Means • Squared differences Fisher (1922) Squared has minimum variance under normal distribution
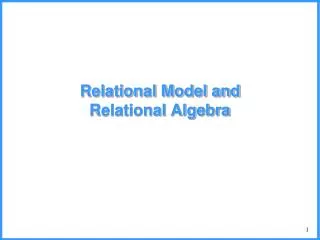
Covariance • Measure of association between two variables • Closely related to variance • Useful to partition variance
Deviations in two dimensions :x + + + + + + + + + + + + + + :y + + + + + + + + + + + + + + + + + + +
Deviations in two dimensions :x dx + dy :y
Measuring Covariation Concept: Area of a rectangle • A square, perimeter 4 • Area 1 1 1
Measuring Covariation Concept: Area of a rectangle • A skinny rectangle, perimeter 4 • Area .25*1.75 = .4385 .25 1.75
Measuring Covariation Concept: Area of a rectangle • Points can contribute negatively • Area -.25*1.75 = -.4385 1.75 -.25
Measuring Covariation Covariance Formula: Average cross-product of deviations from mean F = E(xi- :x)(yi - :y) xy N
Correlation • Standardized covariance • Lies between -1 and 1 r = F xy xy 2 2 F* F y x
Summary Formulae for sample statistics; i=1…N observations : = (Exi)/N Fx = E (xi - :x) / (N) 2 2 Fxy= E(xi-:x)(yi-:y) / (N) r= F xy xy 2 2 FF x x
Variance covariance matrix Several variables Var(X) Cov(X,Y) Cov(X,Z) Cov(X,Y) Var(Y) Cov(Y,Z) Cov(X,Z) Cov(Y,Z) Var(Z)
Variance covariance matrix Univariate Twin Data Var(Twin1) Cov(Twin1,Twin2) Cov(Twin2,Twin1) Var(Twin2) Only suitable for complete data Good conceptual perspective
Conclusion • Means and covariances • Basic input statistics for “Traditional SEM” • Easy to compute • Can use raw data instead
Likelihood computation Calculate height of curve -1
Height of normal curve Probability density function :x N(xi) -3 -2 -1 0 1 2 3 xi N(xi) is the likelihood of data point xi for particular mean & variance estimates
0.5 0.4 0.3 3 2 1 0 -3 -2 -1 -1 0 -2 1 -3 2 3 Height of bivariate normal curve An unlikely pair of (x,y) values :y yi :x xi
Exercises: Compute Normal PDF • Get used to Mx script language • Use matrix algebra • Taste of likelihood theory