Download
1 / 29
290 likes | 427 Views
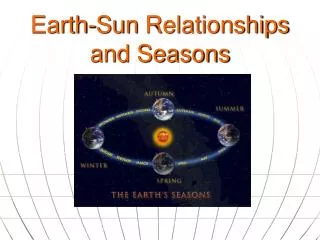
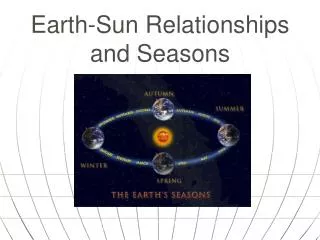
Chapter 2 Solar Energy to Earth and the Seasons. Robert W. Christopherson Charlie Thomsen. Solar Energy to Earth and the Seasons. The Solar System, Sun, and Earth Solar Energy: From Sun to Earth The Seasons . Milky Way Galaxy. Figure 2.1. Our Solar System. Figure 2.1.

E N D
Chapter 2Solar Energy to Earth and the Seasons Robert W. Christopherson Charlie Thomsen
Solar Energy to Earth and the Seasons • The Solar System, Sun, and Earth • Solar Energy: From Sun to Earth • The Seasons
Milky Way Galaxy Figure 2.1
Our Solar System Figure 2.1
Dimensions and Distances • Earth’s orbit • Average distance from Earth to the Sun is 150,000,000 km (93,000,000 mi) • Perihelion – closest distance (at January 3) • 147,255,000 km (91,500,000 mi) • Aphelion – farthest distance (at July 4) • 152,083,000 km (94,500,000 mi) • Plane of Earth’s orbit is the plane of the ecliptic
Solar Energy: From Sun to Earth • Electromagnetic spectrum of radiant energy • Intercepted energy at the top of the atmosphere-insolation
Wavelength and Frequency Longer wave length, lower frequency, and lower intensity Figure 2.5
The Electromagnetic Spectrum • Sun radiates shortwave energy • Earth radiates longwave energy
The Electromagnetic Spectrum of the sun Ultra Violet: <0.4μm (8%) Visible light: 0.4-0.7μm (47%) Infra-red: >0.7μmb(45%) Figure 2.6
Solar and Terrestrial Energy Figure 2.7
Earth’s Energy Budget Insolation: intercepted solar radiation Solar constant: average value of the insolation received at the top of the atmosphere when earth is at its average distance from the sun Figure 2.8
Distribution of Insolation • Tropics receive more concentrated insolation due to Earth’s curvature (higher solar angles) • Tropics receive 2.5times more than poles
The higher the solar angle, the stronger intensity of solar radiation Direct rays: perpendicular to the earth’s surface. The highest solar angle. Direct rays only occur between Tropic of Cancer (23.5N) and Tropic of Capricorn (23.5S). Subsolar point: the only point (latitude) on the earth’s surface that receives direct rays Sun’s inclination: latitude of the subsolar point
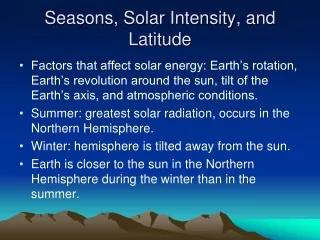
The Seasons • Seasonality • Reasons for seasons • Annual march of the seasons
Seasonality • Seasonal changes in • Sun’s altitude – angle above horizon • Declination – location of the subsolar point • Daylength
Reasons for Seasons • Revolution • Rotation • Tilt of Earth’s axis • Axial parallelism
Revolution and Rotation Figure2.13
Reasons for Seasons 1. Revolution-length of the year • Earth revolves around the Sun • Voyage takes one year • Earth’s speed is 107,280 kmph (66,660 mph) 2. Rotation-length of the day • Earth rotates on its axis once every 24 hours • Rotational velocity at equator is 1674 kmph (1041 mph)
Axial Tilt and Parallelism (Circle of illumination) Figure 2.14
Reasons for Seasons • Tilt of Earth’s axis • Axis is tilted 66.5° from plane of ecliptic • Axial parallelism • Axis maintains alignment during orbit around the Sun • North pole points toward the North Star (Polaris)
Annual March of the Seasons Figure 2.15
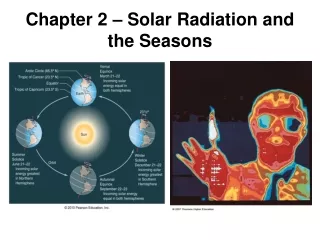
Annual March of the Seasons • Winter solstice – December 21 or 22 • Subsolar point Tropic of Capricorn; shortest daylight hours in NH. • Spring equinox – March 20 or 21 • Subsolar point Equator; equal daylight and night hours everywhere on the earth • Summer solstice – June 20 or 21 • Subsolar point Tropic of Cancer; Longest daylight hours in NH • Fall equinox – September 22 or 23 • Subsolar point Equator; equal daylight and night hours
11:30 P.M. in the Antarctic Figure 2.16
Midnight Sun Figure 2.17
Seasonal Observations Figure 2.18
If the tilted angle is 60 degrees to the plane of ecliptic, where would be tropics and circles? • Arctic/antarctic circle=titled angle (60ºN/S) • Tropics = 90-titled angle (30ºN/S) • Increased tropics area and increased polar areas • Larger seasonal variations in most places
If the tilted angle is 90 degree to the plane of ecliptic? • Circles would be at 90ºN/S • Tropics would be at equator • No seasonal variation • No day length changes