Introduction to the use of data and analysis
Introduction to the use of data and analysis. Dr Sofia Izquierdo-Sanchez Senior Lecturer in Economics Co-Deputy Director Research Centre for Productivity Improvement (RCPI). Be open to unanticipated patterns and results. You may have a story to tell and data can help you to solve the problem.

Introduction to the use of data and analysis
E N D
Presentation Transcript
Introduction to the use of data and analysis Dr Sofia Izquierdo-Sanchez Senior Lecturer in Economics Co-Deputy Director Research Centre for Productivity Improvement (RCPI)
Be open to unanticipated patterns and results • You may have a story to tell and data can help you to solve the problem. • You don’t always have to start with a question, data may come first (“Data Mining”) • Have an open mind and be prepared to explain unexpected results
Explain things and measure their value • We use data to describe an issue or to solve a problem. • The results we obtain have to be transformed and organised to be presented to the relevant audience. • Data can be in different forms: • Qualitative • Quantitative
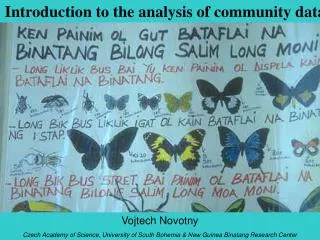
Text: words and/or descriptions • Qualitative data: Data can come from interviews, open-ended questions on a survey, etc. For example: gender, race, or the description of an object. • Although it may seem difficult to use this data for our purposes, most of the times it contains valuable information we cannot ignore in our analysis. • Think that this data can be easily transformed to quantitative data to satisfy our purposes.
Numbers • Quantitative data: Usually data is expressed with numbers. For example: age, rating scales, or length. • Quantitative data can be divided in groups (“categorical data”), and so one id (item, person, etc) cannot belong to more than one group at a specific time. • Quantitative data can be measured on a continuous range of scale (“continuous data”)
Is your data telling a story? • The aim is to make statements about a population. However we cannot have information about a whole population. We need to select a sample from the population of interest. • Is this sample representative? • Problems: • Bias • Outliers • Missing data • etc.
Different types of data, different types of research • Qualitative research: it explains how, within a particular context, an occurrence operates. • Quantitative research: it explores the (causal) relationship between two events or occurrences, where one of the events is a consequence of the other one.
Qualitative vs Quantitative Note: (1) definitions and table can be found at: “6 methods of data collection analysis”. Monitoring, Evaluation, Accountability and Learning (MEAL), Open University.
A question for you Are you interesting in learning more about data analysis or about any of the statistical packages? Let us know
Northern Productivity Hub For information about the Northern Productivity Hub and their goals and services visit their webpage: https://www.hud.ac.uk/business/northernproductivityhub/ E-mail: productivity@hud.ac.uk