Download
1 / 19
190 likes | 349 Views
Searching for electron-positron annihilation line from Galactic compact objects with IBIS. G. De C esare, INAF-IASF, Rome. Outlines. Positrons in the Galaxy: first detection in 1970 Positrons in the Galaxy: 511 keV emission from 1E 1740.7-2942 in 1990 The Galactic positrons origin

E N D
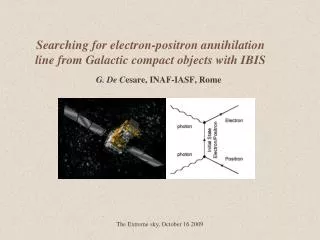
Searching for electron-positron annihilation line from Galactic compact objects with IBIS G. De Cesare, INAF-IASF, Rome The Extreme sky, October 16 2009
Outlines • Positrons in the Galaxy: first detection in 1970 • Positrons in the Galaxy: 511 keV emission from 1E 1740.7-2942 in 1990 • The Galactic positrons origin • The IBIS Data sample • The energy bands in our analysis • The IBIS/ISGRI effective area by Monte Carlo simulation • The IBIS 511 keV line sensitivity • The first 511 keV all sky sensitivity map • Flux upper limits: MQs • Flux upper limits: SNs • Searching in shorter time scales: Galactic center visibility periods • Future perspectives: EXIST ? • Conclusions The Extreme sky, October 16 2009
Positrons in the Galaxy: first detection in 1970 A balloon flight conducted in 1970 with scintillators detectors gave a first indication Balloons flight with Ge detectors gave electron-positron annihilation proof • Haymes et al 1975 : 530+/-10 keV • Leventhal et al 1978: 511 keV Haymeset al 1975 Leventhal et al 1978 The Extreme sky, October 16 2009
Positrons in the Galaxy: 511 keV emission from 1E 1740.7-2942 in 1990 • Discovered by Einstein X-ray telescope (Herz & Grindlay, 1984) • The position is about 1 degree from the Galactic center • Detected by INTEGRAL/IBIS with a flux of (29.8 0.1) m Crab (3th survey A.J. Bird, 2007) • During the 1990 October 13 the SIGMA telescope, aboard the GRANAT space observatory, discovered that this source was exhibiting a remarkable feature in its emission spectrum (See e.g. Bouchet et al. 1991) • This transient feature appeared during a 13 hours observation and then possibly in two further occasions but at a less significant level. • The 511 keV feature of 1E 1740.7-2942 has not been confirmed by OSSE (Jung et al. 1995). The Extreme sky, October 16 2009
The Galactic positrons origin • Many ideas and models have been proposed since 70’ years until today, but the Galactic positron origin is still unclear. • Taking into account of the INTEGRAL/SPI observational constraints(Bulge/Disk ratio, inner disk asymmetry) the following ides have emerged : • Low Mass X-ray Binaries • Supernovae (Higdon et al., 2009) • Dark Matter (Boem et al., 2004) have emerged as possible candidates. However the asymmetry is controversial (J.P. Roques, this workshop) The SPI sky map in the 511 keV electron-positron annihilation line and the sky distribution of the hard X (E > 20 keV) LMXBs detected by IBIS (Weidenspointner et al., 2008) The Extremesky, October 16 2009
The IBIS Data • About 5 years of observations, using all public data from the INTEGRAL launch until April 2007 and the Core program data until April 2008. • The reduction of that amount of data is time consuming: the data have been prepared and processed in collaboration with the IBIS survey team (see A.J. Bird talk in this Workshop). The IBIS exposure map. The deeper observations correspond to the Galactic center region, where we reach with our data a 10 Ms exposure The Extreme sky, October 16 2009
The energy bands in our analysis The ISGRI energy resolution has been estimated from the background spectra • We have selected three bands: • 431 - 471 keV • 491 - 531 keV • 551 - 591 keV ISGRI background spectrum accumulated during one ScW ISGRI 511 keV energy peak and FWHM histogram The Extreme sky, October 16 2009
The sensitivity… The sensitivity in the gamma ray domain is due on the (low) effective area and the (high) background The Extreme sky, October 16 2009
The IBIS/ISGRI effective area by MC simulation We need the effective area to convert counts in photons. Using a physical Monte Carlo code we can simulate an on-axis 511 keV point source and them evaluate the detected photons. The code is based on GEANT3 FORTRAN library and an IBIS mass model. Det. Efficiency = 0.8 % An IBIS simulation with a 511 keV on axis mono-energetic beam. The simulated ISGRI shadowgram is shown in the left panel and the decoded image in the right panel. The Extreme sky, October 16 2009
The IBIS 511 keV line sensitivity We measure: Count = Source + Background But we need: Source = Count - Background Therefore the sensitivity (assuming B >> S) for a given effective area is in principle just limited by the Background square root: In general the background in time dependent. To have an idea of the sensitivity, during the revolution 50 we estimated: ISGRI Background = 7.85 counts/s PICsIT Background = 150 counts/s Assuming a flux F = 10-3 ph cm-2 s-1 S = F x A = 0.027 counts/s S/B = 0.34 % …the assumption that at 511 keV IBIS is Background dominated is correct. For IBIS/ISGRI we estimate a 2 sigma sensitivity of the order of 10-4 ph cm-2 s-1 with an exposure of 10 Ms Taking into account the PICsIT(*) background and effective area, that we have estimated, the IBIS/PICsIT statistical sensitivity should be 2 times better than the IBIS/ISGRI one. (*) An improved IBIS/PICsIT data analysis is discussed by P. Lubinski, 2008. PICsIT background spectrum accumulated during one ScW The Extreme sky, October 16 2009
The IBIS/ISGRI 5 years all sky map in the 511 keV line The Extreme sky, October 16 2009
The first 511 keV all sky sensitivity map 2σ IBIS 511 keV IBIS all sky sensitivity map. A zoom near the galactic center is shown in the bottom panel. 1 E 1740.7-2942 and GRS 1758-2258: 1.6 10−4 ph cm−2 s−1 Sco X-1: 3.7 10−4 ph cm−2 s−1 IBIS LMXBs distribution Stacking all the sources, the 511 keV statistical upper limit that we obtain is 2 x 10⁻⁵ ph cm-2 s-1 The Extreme sky, October 16 2009
Flux upper limits: MQs 511 keV 2σ flux upper limits for the hard X (E > 20 keV) microquasars reported in the 3rd IBIS catalogue 511 keV 2σ upper flux limit during the hard X outburst of GRO J1655-40 and GX 339-4 The Extreme sky, October 16 2009
Flux upper limits: SNRs 511 keV 2σ flux upper limits for the hard X (E > 20 keV) Supernova Remnants reported in the 3rd IBIS catalogue. The Extreme sky, October 16 2009
Searching in shorter time scales: GC visibility periods 511 keV 2σ upper flux limits, that are estimated for Sgr A*, in the Galactic Center visibility periods. The Extreme sky, October 16 2009
Future perspectives: EXIST ? Thanks to the large detector area and high thickness the actual IBIS 511 keV gamma ray line sensitivity should be improved by a factor 10 and more. See L. Natalucci Talk (tomorrow) See M. Quadrini Poster The Energetic X-ray Imaging Survey Telescope (EXIST) mission will make use of about 6 m2 of > 0.5 cm thick (the ISGRI thickness is 0.2 cm) Cadmium Zinc Telluride (CZT) detectors to record X and gamma rays in the energy range from 10 keV to 600 keV. The Extreme sky, October 16 2009
Summary and conclusions • With IBIS/ISGRI we searched for 511 keV emission in point sources at day-month-year time scales • We do not detect 1E 1740.7-2942 in the 511 keV line at any time scale (from this source a transient emission was detected by SIGMA in 1990) • We provide the first IBIS 5 year full sky map in the 511 keV line …unfortunately without detecting any significant signal. The 2 sigma flux upper in the Galactic center region, with an exposure of 10 Ms, is estimated at a level of 1.6 x 10⁻⁴ ph cm-2 s-1 • Stacking all the hard X LMXBs sources the statistical limit that we obtain is of order of 2 x 10⁻⁵ ph cm-2 s-1 • The IBIS data are in agreement with the idea that positrons should travel in the Interstellar medium before annihilate • An improvement of a factor 10 or even more in sensitivity is expected for future missions like EXIST The Extreme sky, October 16 2009
To do list • Process PICsIT data • Compton (ISGRI-PICsIT coincidence) data? • Light Bucket analysis? I am open for collaborations: decesare.giovanni@gmail.com The Extreme sky, October 16 2009
Monte Carlo Simulation: an interactive section The Extreme sky, October 16 2009 The Extreme sky, October 16 2009