Download

1 / 12
130 likes | 359 Views
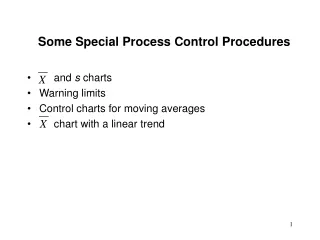
Some Special Process Control Procedures. and s charts Warning limits Control charts for moving averages chart with a linear trend. and s Chart. Why s chart instead of R chart?

E N D
Some Special Process Control Procedures • and s charts • Warning limits • Control charts for moving averages • chart with a linear trend
and s Chart • Why s chart instead of R chart? • Range is computed with only two values, the maximum and the minimum. However, s is computed using all the measurements corresponding to a sample. • For large samples, s becomes a much better estimator (of standard deviation) than R.
and s Chart • The control limits of chart are Note: This can also be written as Where
and s Chart • Previously, the value of has been estimated as: • The value of may also be estimated as: where, is the sample standard deviation and is as obtained from Appendix 3 • Control limits may be different with different estimators of (i.e., and )
and s Chart • The control limits for charts are: Where, the values of are as obtained from Appendix 3
and s Chart • For variable sample size, each of the is obtained from an weighted average:
and s Chart • For nearly uniform samples sizes, may be obtained from unweighted averages: • Following is a rule that identifies nearly uniform sample sizes • a rule: the largest sample is at least twice the smallest
and s Chart • For large samples:
Warning Limits • Two sets of limits on charts • Outer limits - conventional 3 sigma limits • Inner limits - warning limits usually set at 2 sigma • Two sets of limits may be confusing. However, they can be very useful too: • Two points in succession outside the same inner limit give stronger evidence of a process shift • Similarly, strong evidences are two points out of three beyond one inner limit, three out of seven, four out of ten etc.
Problem 10.1: A certain company manufactures electronic components for television sets. One particular component is made to a critical length of 0.450 in. On the basis of past production experiences, the standard deviation of this dimension is 0.010 in. Because of the critical nature of the dimension, the quality control group maintains warning limits on control chart as well as the normal 3-sigma control limits. The chart is based on subgroups of four samples, and warning limits are maintained at two standard deviations from the mean. Compute the warning limits and the control limits for the chart.
Problem 10.2: For Problem 10.1 (a) What is the probability that a subgroup average will exceed the UWL but not exceed the UCL when the process is correctly centered? (b) Supervisor should be notified if (i) 2 successive subgroup averages exceed one of the warning limits or (ii) if one subgroup average exceeds either of the control limits. What is the probability that, when there has been no change in the process, the supervisor will have to be notified because of (i) or (ii)? (c) If the process suddenly shifts to 0.460 with no change in the standard deviation, what is the probability that 2 successive points will exceed the upper warning limit but not exceed the upper control limit?
Reading and Exercises • Chapter 10 ( and s charts): • pp. 362-368 (Section 10.1-2) • 10.3, 10.4, 10.5