Download

1 / 70
820 likes | 1.32k Views
Microarray. Yuki Juan NTUST May 26, 2003. Content. Biology background of microarray Design of microarray The workflow of microarray Image analysis of microarray Data analysis of microarray Discussion. The Biology Background of Microarray. The central dogma of life forms DNA RNA

E N D
Microarray Yuki Juan NTUST May 26, 2003
Content • Biology background of microarray • Design of microarray • The workflow of microarray • Image analysis of microarray • Data analysis of microarray • Discussion
The Biology Background of Microarray • The central dogma of life forms • DNA • RNA • Monitoring the expression of genes
Central Dogma • DNA Replication --ACGCGA-- --TGCGCT-- • RNA Transcription --UGCGCU-- • Protein Translation --CYSALA--
DNA replication transcription translation DNA RNA Protein
DNA • The double helix • stable • Nucleotide • A, T, G, C • Base pair • A – T • G – C • Oligonucleotide • short DNA (tens of nucleotides, or bps) (http://www.nhgri.nih.gov/)
DNA Strand • DNA has canonical orientation • read from 5’ to 3’ • antiparallel: one strand has direction opposite to its complement’s 5’ … TACTGAA … 3’ 3’ … ATGACTT … 5’
Hydrogen Bond Makes DNA Binding Specifically Hydrogen bond 5’ 3’ 5’ 3’
Hydrogen Bond Makes DNA Binding Specifically • The force between base pair is hydrogen bond, This force let A-T(U), C-G can specifically match together.
RNA replication transcription translation DNA RNA Protein
RNA • Types • messenger RNA • ribosomal RNA (rRNA) • transfer RNA (tRNA) Gene is expressed by transcribing DNA into single-stranded mRNA
RNA (Detailed) (http://www.nhgri.nih.gov/)
Reverse Transcription replication transcription translation DNA RNA Protein Reverse Transcription By reverse transcriptase, we can convert RNA into cDNA.
The Southern Blot • Basic DNA detection technique that has been used for over 30 years, known as Southern blots: • A “known” strand of DNA is deposited on a solid support (i.e. nitocellulose paper) • An “unknown” mixed bag of DNA is labelled (radioactive or flourescent) • “Unknown” DNA solution allowed to mix with known DNA (attached to nitro paper), then excess solution washed off • If a copy of “known” DNA occurs in “unknown” sample, it will stick (hybridize), and labeled DNA will be detected on photographic film
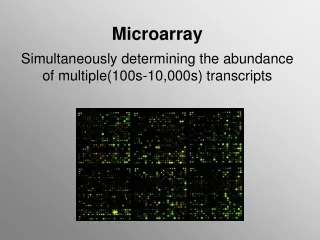
mRNA Represent Gene Function • When measure the level of a mRNA, we are monitoring the activity of a gene. • Thus, if we can understand all the level of mRNAs, we can study the expression of whole genome. • Microarray takes the advantage of getting over 10000 of blotting data in a single experiment, which makes monitoring the genome activity possible.
Content • Biology background of microarray • Design of microarray • The workflow of microarray • Image analysis of microarray • Data analysis of microarray • Discussion
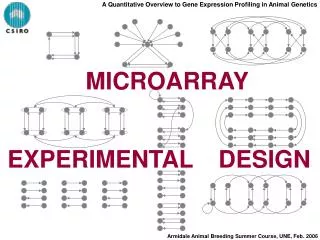
Design of Microarray • Microarray in different context • The idea of microarray • Main type of array chips
mRNA Levels Compared in Many Different Contexts • Different tissues, same organism (brain v. liver) • Same tissue, same organism (tumor v. non-tumor) • Same tissue, different organisms (wt v. mutant) • Time course experiments (development) • Other special designs (e.g. to detect spatial patterns).
Idea of Microarray Cell A Cell B Labeled cDNA from geneX Hybridizaton to chip Spot of geneX with complementary sequence of colored cDNA This spot shows red color after scanning.
Several Types of Arrays • Spotted DNA arrays • Developed by Pat Brown’s lab at Stanford • PCR products of full-length genes (>100nt) • Affymetrix gene chips • Photolithography technology from computer industry allows building many 25-mers • Ink-jet microarrays from Agilent • 25-60-mers “printed directly on glass slides • Flexible, rapid, but expensive
Array FabricationSpotting • Use PCR to amplify DNA • Robotic "pen" deposits DNA at defined coordinates • approximately 1-10 ng per spot • Experimentation with oligos (40, 70 bp)
Array Fabrication Photolithography • Light activated synthesis • synthesize oligonucleotides on glass slides • 107copiesper oligo in 24 x 24 um square • Use 20 pairs of different 25-mers per gene • Perfect match and mismatch
50um Affymetrix Microarrays Raw image 1.28cm ~107 oligonucleotides, half perfectly match mRNA (PM), half have one mismatch (MM) Raw gene expression is intensity difference: PM - MM
Agilent cDNA microarray and oligonucelotides microarray • Agilent delivering printed 60-mer microarrays in addition to 25-mer formats. • The inkjet process uses standard phosphoramidite chemistry to deliver extremely small volumes (picoliters) of the chemicals to be spotted.
Content • Biology background of microarray • Design of microarray • The workflow of microarray • Image analysis of microarray • Data analysis of microarray
The Workflow of Microarray sample Plate Plate Preparation RNA extraction Array Fabrication cDNA synthesis and labeled Array Hybridization Labeled cDNA Hybridized Array Scanning
Cy3 and Cy5 cDNA Hybridization On To The Chip e.g. treatment / control normal/tumor tissue Sample loading 1.Loading from the corner of the cover slip It is time consuming and easily producing bubbles. 1 2. Loading sample at the center of array then put the slip smoothly Faster, and have lower chance of bubble producing then the last one. 2 Sample loading 3. Loading sample at the side of the array then put the slip on. Solution would attach to the slip right after the slip contact with it, and would diffuse with the movement of slip when we slowly move down. 3 Sample loading
Scan Green: down regulate Red: up regulate Yellow: equal level
Content • Biology background of microarray • Design of microarray • The workflow of microarray • Image analysis of microarray • Data analysis of microarray • Discussion
Image analysis • To find a spot • Convert feature into numeric data • Image normalization
The Algorithms 1. Find spots: Finds the location of each spot on the microarray. 2. Cookie cutter algorithm: (1).Suppose the distribution of pixels vs intensity is Gaussian curve (2).Using SD or IQR to identify the feature and background of each spot (3).Calculates statistics for the pixel population
Interquartile Range(IQR) D K=IQR/2 1.42 IQR Boundary for rejection 25% 50% 75% Boundary for rejection IQR
Feature or cookie D Local background Exclusion zone
Irregular size or shape Irregular placement Low intensity Saturation Spot variance Background variance Data Quality miss alignment artifact bad print indistinguishable saturated
Convert Feature Into Numeric Value Green background Green b.g.-corrected Red b.g.-corrected (R. b.g.-c)/(G. b.g.-c) Red intensity Green intensity Systematic name Red b.g. Gene function
Data Normalization • Normalize data to correct for variances • Dye bias • Location bias • Intensity bias • Pin bias • Slide bias • Control vs. non-control spots
Data Normalization Uncalibrated, red light under detected Calibrated, red and green equally detected
Data Normalization • Assumptions • Overall mean average ratio should be 1 • Most genes are not differentially expressed • Total intensity of dyes are equivalent
Additional Normalization • Pin dependent • Similar to intensity dependent fit. • Compute individual lowess fits for each pin group • Within slide normalization • After pin dependent normalization, log ratios for each pin are centered around 0 • Scale variance for each pin • Uses MAD (median absolute deviation)
Additional Normalization • Dye swap • Combine relative expression levels without explicit normalization • Compute lowess fit for log2(RR’/GG’)/2 vs. log2(A + A’)/2 • Normalized ratio is log2(R/G) - c(A) where c(A) is the lowess prediction
Content • Biology background of microarray • Design of microarray • The workflow of microarray • Image analysis of microarray • Data analysis of microarray • Discussion
Data analysis • Data filtering • Fold change analysis • Classification • Clustering • Future direction
Microarray Data Classification Microarray chips Images scanned by laser Gene Value D26528_at 193 D26561_cds1_at -70 D26561_cds2_at 144 D26561_cds3_at 33 D26579_at 318 D26598_at 1764 D26599_at 1537 D26600_at 1204 D28114_at 707 Datasets New sample Data Mining and analysis Prediction:
The Threshold of Spots • Filtering - remove genes with insufficient variation • Remove insufficient spot: saturated, None uniform, too high background… • Remove extreme signal: e.g. MaxVal - MinVal < 500 and MaxVal/MinVal < 5 • Statistical filtering (e.g. p-value<0.01) • biological reasons • feature reduction for algorithmic