Download

1 / 23
230 likes | 327 Views
Explore techniques for identifying and managing process control issues in a plastic factory, focusing on yield consistency and strategies for improvement. Learn about DMAIC methodology and active solutions for maintaining tighter control. Discover how to utilize data patterns and hypothesize causes for system deviations.

E N D
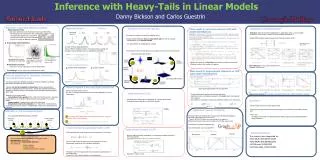
Comparing Distributions I: DIMAC and Fishers Exact By Peter Woolf (pwoolf@umich.edu) University of MichiganMichigan Chemical Process Dynamics and Controls Open Textbookversion 1.0 Creative commons
Scenario: You run a small plastic factory described in an earlier lecture You have already developed the P&ID, control architecture, and parameterized your controllers. The system is running well most of the time, but not always. Generally you get a 30% yield, but not always. If the yield is above 32% or below 28% then the batch can’t be sold. How do you tell if the system is out of control? What do you do if it is out of control? What strategies can you adopt to maintain tighter control?
Goal: Consistent yield DMAIC: Define, measure, analyze, improve, and control Measure yield Control charts, detective work Change system and/or policies
1) Make some measurements How do you tell if the system is out of control?
How do you tell if the system is out of control? 2) Construct a control chart Statistically out of control because run 9 exceeds the UCL Now what??
What if you are out of control? Passive solution • Log it and do nothing. Wait for it to happen again before taking action • Note lost opportunity to improve process, and possible safety risk.
What if you are out of control? Semi-passive solutions • Resample to make sure it is not an error • Odd that this is not done when things are okay.. • Adjust calculated mean up or down to adjust to the new situation • Treat the symptom, not the cause • Lost opportunity to learn about the process
What if you are out of control? Active solution • Look for a special cause and remove or enhance it. • Not all changes are bad, some may actually improve the process.
Look for a special cause Possible sources of information: Patterns in the data Association with unmeasured events Known physical effects Operators Field observation: “The feed for run 9 seemed unusually runny--maybe that is the reason?”
Data from 25 runs Runny feed Normal feed Bad product 5 1 Good product 1 18 Hypothesis: Runny feed causes the product to go out of our desirable range. Gather data Evaluate hypothesis Make a model of the relationship (1) Is this significant? (2) What causes the feed to be runny? (3) Can we develop strategies to cope with this?
Runny feed totals Normal feed Bad product 5 1 6 Good product 1 18 19 6 19 25 totals Marginal results (sums on the side that count over one of the states) Is this significant? --> What are the odds? 2 answers depending on the question: What are the odds of choosing 25 random samples with this particular configuration What are the odds of choosing 25 samples with these marginals in this configuration or more extreme?
What are the odds of choosing 25 samples with these marginals in this configuration or more extreme? Break down the problem: For the 6 bad products, odds of 5 with runny feed, 1 normal? Remove 6 balls Urn Runny feed totals Normal feed Bad product 5 1 6 Good product 1 18 19 6 19 25 totals What are the odds? Restate as an urn problem: with 25 balls, 6 are white and 19 black, what are the odds of drawing 6 balls of which 5 are white and 1 is black?
Remove 6 balls Odds of this draw Urn Restate as an urn problem: with 25 balls, 6 are white and 19 black, what are the odds of drawing 6 balls of which 5 are white and 1 is black? Number of ways of choosing 1 out of 19 of the black balls Number of ways of choosing 5 out of 6 of the white balls Number of ways of choosing 6 out of 25 balls
Odds of this draw Reads “a choose b” where Restate as an urn problem: with 25 balls, 6 are white and 19 black, what are the odds of drawing 6 balls of which 5 are white and 1 is black? Remove 6 balls Urn Hypergeometric distribution: probability sampling exactly k special items in a sample of n from an urn containing N items of which m are special
What are the odds of choosing 25 samples with these marginals in this configuration or more extreme? Runny feed totals Normal feed Bad product 5 1 6 Good product 1 18 19 6 19 25 totals What are the odds? • Analogous arguments can be made for: • 1 in 19 of the good products having runny feed • 1 in 6 of the runny feed products being good products • 1 in 19 of the normal feeds being bad product Composite probability can be calculated using Fisher’s exact test
Runny feed totals Normal feed Bad product a b a+b Good product c d c+d a+b b+d a+b+c+d totals # of ways the marginals can be arranged # of ways the total can be arranged # of ways each observation can be arranged Fisher’s exact is the probability of sampling a particular configuration of a 2 by 2 table with constrained marginals
What are the odds of choosing 25 samples with these marginals in this configuration? In Mathematica: Runny feed totals Normal feed Bad product 5 1 6 Good product 1 18 19 6 19 25 totals But this is for this configuration alone! Is this one of many bad configurations?
What are the odds of choosing 25 samples with these marginals in this configuration? Probability estimate at a particular value Estimate at a value or further Or more extreme values.. Runny feed totals Normal feed Bad product 5 1 6 Good product 1 18 19 6 19 25 totals One tail test..
What are the odds of choosing 25 samples with these marginals in this configuration or more extreme? A more extreme case with the same marginals Runny feed Normal feed totals Bad product 6 0 6 Good product 0 19 19 6 19 25 totals P-value = 0.00064+ 0.0000056 =0.0006456 Runny feed totals Normal feed Bad product 5 1 6 Good product 1 18 19 Pfisher=0.00064 6 19 25 totals Pfisher=0.0000056
P-values P-values can be interpreted as the probability that the null hypothesis is true. Null hypothesis: Most common interpretation is completely random event, sometimes with constraints Examples of null hypotheses: • Runny feed has no impact on product quality • Points on a control chart are all drawn from the same distribution • Two shipments of feed are statistically the same Often p-values are considered significant if they are less than 0.05 or 0.001, but this limit is not guaranteed to be appropriate in all cases..
1) Data Runny feed totals Normal feed Bad product 5 1 6 Good product 1 18 19 6 19 25 totals Look for a special cause Note: Runny feed is not the only cause as sometimes we get good product from runny feed.. 2) Analysis: p-value=0.00064<0.05 3) Conclusion: runny feed significantly impacts product quality
Look for a special cause 3) Conclusion: runny feed is likely to impact product quality • What next? • Look for root causes: What causes runny feed? Supplier? Temperature? Storage conditions? Lot number? Storage time? • - very process dependent • Develop a method to detect runny feed before it goes into the process
Take Home Messages • After you identify a system is out of control, take appropriate action • Associations between variables can be identified using Fisher’s exact tests and its associated p-value • Once the cause of a disturbance is found, find a way to eliminate it