Download
1 / 81
810 likes | 823 Views
Learn to set and track goals effectively in high school science education. Discover item analysis and data-driven approaches. Join us!

E N D
Progress Monitoring in the High School Science Classroom, 9-12 Gary Carlin Science Instructional Specialist (718) 828-5943 (o) (917) 714-7448 (b) gcarlin@schools.nyc.gov
Traditional Progress Monitoring • “Education professionals have traditionally relied on a wait-to-fail formula to identify and assist students experiencing academic difficulties.”
Workshop Goals 1. Explore the Quality Review to establish a connection between Progress Monitoring & Goals. 2. Model a system of goal setting that includes Annual and Interim Skill-based Goals for science instruction. 3. Introduce Item Analysis to support Progress Monitoring & Goal Setting.
Introductory Activity • Alphabet Squares • List words that would help you to identify, describe, define, or relate to “progress” in terms of your students. • In terms of “progress monitoring”, which 5 words best describe your practice with your students?
What is Progress? • A movement toward a goal or to a further or higher stage. Academic Achievement • Subject-Specific Content (Content) • Thinking and Reasoning Skills (ProcessSkills) • General Communication Skills (Communication Skills)
Starting Definitions • Goal: the result or achievement toward which effort is directed • Objective: something that one's efforts or actions are intended to attain or accomplish; purpose; goal; target
Instructional coherence • Gather and analyze data • Monitor and revise • Plan and set goals • Align capacity building Activity One How many different ways does the Quality Review Criteria Rubric 2009-2010 refer to or describe “goals”?
The word “Goal” in the QR • Learning • Clear • Focused • Measurable • Data-based • School-wide • Annual • Interim • Differentiated • School-, Team-, Classroom-level • High • Long term • Instructional • Child/Youth Development 16
QR: Quality Statement 3Plan and Set Goals • School leaders and faculty consistently engage the school community to use data to set and track suitably high goals for accelerating student learning.
Quality Statement 3 Indicators • 3.1 Establish a coherent vision of future development that is reflected in a short list of focused, data-based goals that are understood and supported by the entire school community. • 3.2 Use collaborative and data informed processes to set measurable and differentiated learning goals for student subgroups, and students in need of additional support.
Well-developed • 3.2 a Individual teachers and teachers teams use data to set annual and interim goals for groups of students for whom they are responsible. • 3.2 b IT and TT effectively and consistently analyze data to identify which students need additional supports and extensions, and set differentiated annual and interim goals for those students to accelerate their learning so all students are on a path to mastery of learning standards and fulfilling their potential.
Progress Monitoring • 3.3 Ensure the achievement of learning goals by tracking progress at the school, teacher team, and classroom level.
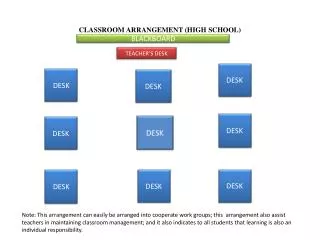
Activity Two • Task: Write a general procedure (set of numbered steps) for your students to “read” a line graph. Step - Rationale- ”Red Zones” - Support
Educational Definitions • Goals – Overarching purpose of curriculum. • Objectives – day-to-day instructional targets (ASWBAT) • Used interchangeably in research
Two Types of Goals/Knowledge • Declarative – information, “content” • Students will understand … • Procedural – skills, strategies, and processes • Students will be able to …
Learning Goals Is a statement of what students will know or be able to do. • Classroom activities and assignments support learning goals. • Students will understand (more specific: describe, explain) _____ and be able to _____ .
Identify Major Course Goals for Data Collection • 1. Utilize the Scientific Method and Process Skills to state/create/organize/analyze: observations, inferences, hypotheses, experiments, data • 2. Interpret and Draw: tables, graphs, charts, dichotomous keys, scientific illustrations, flow charts, concept maps • 3. Use Scientific Tools to Observe and Measure: ruler, graduated cylinder, microscope, thermometer, balance, dissection tools, chromotography & electrophoresis apparatus, • 4. Process Text and Visual Information (diagrams) for written Extended Responses
“Annual Goal for Graphing” • What is it that you would want your students to do in your science class by the end of the year in terms of “Graphing”?
Annual Goal: Graphing • Students should be able to … read and draw graphs so they can insightfully interpret and process information, represent data from scientific investigations, utilize mathematical formulations to represent their thinking, draw conclusions, ask new questions, make predictions and additional hypotheses, and formulate generalizations or explanations of natural phenomena.
Assessment … • is a process of gathering and documenting information (data) about the: • Achievement • Skills • Abilities • Personality variables of an individual
Assessment Task(s) • Determine whether students have attained the learning goal. • G: Students will be able to explain how data presented on a graph can further emphasize the conclusion being presented. • AT: Explain how the scaling on a graph can be modified to best support a specific conclusion.
Goals & Activities • Goals are the reason classroom activities are designed.
The Assessment Cycle • Planning of instruction closely resembles the stages of the scientific method. • Evaluate students’ previous knowledge • Develop hypotheses about the best methods for attaining lesson objectives • Develop a teaching plan based on those hypotheses • Observe the results • Base further instruction on the evidence collected.
Multiple Choice Tests • “Well-designed multiple choice tests are generally more valid and reliable than essay tests because: • they sample material more broadly • discrimination between performance levels is easier to determine • scoring consistency is virtually guaranteed” The Center for Teaching and Learning, UNC, 1990
Activity 3 • What “content” is essential to answer the question? • What is the question assessing about the “skills of graphing”? • Difficulty Rank Order (1-6), Why? • Teaching Implications
42 On which day did the population represented in the graph below reach the carrying capacity of the ecosystem? (J8) • (1) day 11 (3) day 3 • (2) day 8 (4) day 5
37 The graph below provides information about the reproductive rates of four species of bacteria, A, B, C, and D, at different temperatures. (J8) • Which statement is a valid conclusion based on the information in the graph? • (1) Changes in temperature cause bacteria to adapt to form new species. • (2) Increasing temperatures speed up bacterial reproduction. • (3) Bacteria can survive only at temperatures between 0°C and 100°C. • (4) Individual species reproduce within a specific range of temperatures.
16 Some chemical interactions in a human are shown in the graph below. (Ja9) • This graph represents hormones and events in the • (1) process of fetal growth and development • (2) process of meiotic cell division during sperm development • (3) reproductive cycle of males • (4) reproductive cycle of females
29 The graph below shows how the level of carbon dioxide in the atmosphere has changed over the last 150,000 years. (J9) Which environmental factor has been most recently affected by these changes in carbon dioxide level? • (1) light intensity • (2) types of decomposers • (3) size of consumers • (4) atmospheric temperature
42* The graph below shows the changes in the size of a fish population over a period of time. (Ja9) • The dashed line on the graph represents the • (1) carrying capacity of the environment • (2) life span of the species • (3) level at which extinction is reached • (4) level of maximum biodiversity of the species
40 A sample of bacteria was added to a culture dish containing a food supply. The dish was kept in an incubator for two weeks, where temperature and other conditions that favored bacterial growth were kept constant. The graph below shows changes that occurred in the bacterial population over the two weeks. (Ja9) • Which statement provides the best explanation for some of the changes observed? • (1) The bacteria were unable to reproduce until day 8. • (2) The bacteria consumed all of the available food. • (3) The culture dish contained an antibiotic for the first five days. • (4) The temperature increased and the bacteria died.
Activity 4 • What “previous knowledge” did you think these students have in terms of graphing? • What observations do you have about the actual graph? • What additional information can we get from the distracter analysis of our graphing questions? • What are the teaching implications?
42* The graph below shows the changes in the size of a fish population over a period of time. (Ja9) • The dashed line on the graph represents the • (1) carrying capacity of the environment • (2) life span of the species • (3) level at which extinction is reached • (4) level of maximum biodiversity of the species