Download
1 / 20
200 likes | 322 Views
This article delves into the essential role of Accounting Information in business management, emphasizing how balance sheets and profit & loss statements empower managers to monitor their firm's financial health. It covers three critical areas of financial analysis: comparative statements analysis, net working capital analysis, and ratio analysis. Each method provides insights into a firm's past performance, liquidity, and operational efficiency, equipping managers with the necessary tools to make informed financial decisions and ensure effective resource allocation.

E N D
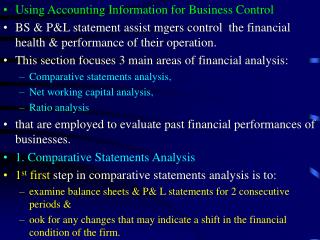
Using Accounting Information for Business Control • BS & P&L statement assist mgers control the financial health & performance of their operation. • This section focuses 3 main areas of financial analysis: • Comparative statements analysis, • Net working capital analysis, • Ratio analysis • that are employed to evaluate past financial performances of businesses. • 1. Comparative Statements Analysis • 1st first step in comparative statements analysis is to: • examine balance sheets & P& L statements for 2 consecutive periods & • ook for any changes that may indicate a shift in the financial condition of the firm.
Let's examine the comparative B/S of AgBiz Corpn. • Current Assets:There is a fall in cash & inventories plus a large increase (500%) in accounts receivable. • This signal problems for the firm as reflects a reduction in the firm's liquidity or ability to pay its bills on time. • Fixed Assets:Unchanged except for a $160,000 (40%) rise in buildings & eqpmt which may imply a reduction liquidity • Total Assets: There is an increase in the value of total assets of 12% (+ $109,200) since last year. • Current Liabilities:Has increase by 116.7% from last year, mainly from accounts payable & installment payments & may reflect a decrease in the firm's liquidity. • Total Liabilities: Has risen slightly since last year. • Total owners' equity: Has increased by the amount of net income ($42,300 from P&L). • Total Liabilities & Owners' Equity: Has risen by $109,200. • Note equation: assets = liabilities + owners' equity, or 1,020,000 = 410,000 + 610,000.
Let's examine the comparative P&L of AgBiz Corpn • Revenue:There is a 17.2% increase in sales revenues • Cost of Goods Sold: Rose just by 10% from last yr to meet the 17.2% increase in sales. • Operating Expenses: There is over 50% (i.e.51.65) increase in operating expenses. • Net Income: Has risen by 41% from last year. This is partly explained by cost of goods sold staying almost the same. • Expenditure Pattern (where each $ was spent) • Year 1: For each $ of sales taken in, $0.821 was spent on COGS ($1,026,000/$1,250,000), leaving $0.179 to contribute to operating expenses & profits. • Year 2: Amount spent on COGS was reduced to $0.771 (i.e. $1,129,000 /$1,105,000), leaving $0.229 for operating expenses & profits. This extra $0.050 per sales dollar may reflect good mgmt.
Operating Expenses as % of Sales:It rose 4.5% from 15% of sales to 19.5%, with largest from salaries & wages, promotion, utilities. These require scrutiny as rising operating expenses can reduce level of profits • Income Before Taxes:Rose from 2.9% of sales to 3.5%. Thus the increases in expenses are well spent, as net income rose from 2.4% to 2.9& of sales. • 2.Net Working Capital Analysis • It measures liquidity by computing the $ that will remain after selling all current assets & paying all current liabilities – i.e. measures availability of cash or "near cash" items to pay bills as they come due. • It is thus the money used to meet the day-to-day expenses of the firm & to meet any emergency expenses.
NWC = difference btwn current assets & current liabilities as shown on balance sheet. NWC = CA - CL • CA = items that will turn to cash within next acctg period • CL = debt items that must be paid within next acctg period. • NWC = current assets (CA)current liabilities (CL) • Includes: Cash Includes:Notes payableSecuritiesAccounts payableAccounts receivableTaxes payableInventory etc.Dividends payable etc.
Examination of AgBiz NWC shows a decrease from Y1 to Y2 but still able to pay all its expected bills. • Current assets - Current liabilities = NWC • Yr 1: $205,000 - $41,500 = $163,500 • Yr 2: 174,000 - 89,500 = 84,050 • A decrease $79,450 • Activities that Impact BS and NWC • 1. Cash purchase of inventory: inventory value rises, cash falls by similar amount, CA remains same. CL are unchanged. Thus NWC remains unchanged. • CA - CL = NWC cashinventory - no change = no change
2. Short-term Credit Purchase of Inventory • CA - CL = NWC inventory - accounts payable = no change • Long-term credit purchase of inventory • CA - CL = NWC inventory - no change = rise by amt of inventory change • 3. Long-term loan payment next year • CA - CL = NWC cash - no change = fall by amt of change in cash • i.e. if CA or CL is used to meet non-current balance sheet item, then NWC changes. This is so cos the accounting equation (assets = liabilities + owners' equity) is always true
Sources and Uses or Application of Net Working Capital • Document valuable to mger/shareholders alike, cos it shows where working capital came from & where it was spent. • Sources of NWCUses of NWC Profits Payment of dividends Sale of fixed assets Purchase of fixed assets Sale of investments Purchase of investments Over 1 yr loans Repayment of debt Sale of stock Retirement of stock Depreciation • Building sources & uses NWC statement requires 2 consecutive BS plus a P&L statements in a 3-step process • Step One: Calculate NWC for each yr & change in NWC. In our example yr 1 NWC = $163,500 & yr 2 NWC = $84,050. NWC Change = $163,500 - $84,050 = $79,450
Step two: Determine sources & uses of NWC items. In our example uses of NWC ($160,200) > the sources of NWC ($80,000) by $79,450 & this is equal to the change in NWC btwn yr1 & yr 2 as shown in step one. • Step three: Examine changes CA & CL by calculating the net changes in CA & CL & their difference. Which should give same amount as change in NWC (i.e. - $79,450). • Purpose of sources & uses statement is to show items that are source of NWC or used for NWC during the year. • In our example, Profits & long-term borrowings were main sources of NWC btwn yr 1 & yr 2 & main of NWC was to the purchase of new fixed assets (buildings & eqpmt). • To accomplish this, cash & inventories were reduced, while accounts receivable, accounts payable, & current portion of long-term debt all rose. • Mgers like to have major source of funds be profits & major use of funds be fixed assets, since this would reflect a healthy, growing firm.
Figure Developing Sources & Uses of Net Working Capital Statement • 1. Determine the Change in the Net Working Capital • YearCurrent Assets - Current Liabilities = Net Working Capital 1 $205,000 - $41,500 = $163,500 2 $174,000 - $89,950 = $84,050 Change in Net Working Capital = $79,450 • 2. Determine the Sources and Uses of Net Working Capital • Sources of NWCUses of NWC Profits (Retained Earnings) $42,300 Dividends 0 Sale of Fixed Assets 0 Purchase of Fixed Assets $160,000 Long-Term Borrowings 18,450 Repay Debt 0 Sale of Stock 0 Retirement of Stock 0 Depreciation 20,000 Other Investments 200 Total Sources $80,750Total Uses $160,200 $80,750- $160,200=$-79,450 • 3. Determine the Changes within Current Assets and Current Liabilities Change in Current Assets-Change in Current Liabilities=Change in NWC $-32,000 Cash $+33,000 Accounts Payable +25,000 Acct. Rec. +250 Taxes Pay, -24,000 Inventories+15,200Current Part of long term Debt $-31,000 Net Change$+48,450 Net Change Current AssetsCurrent Liabilities $-79,450 = Change in NWC
Ratio Analysis • Looks at the relationship (or ratio) btwn components of BS and P&L statement. There are 4 main categories of ratios: • 1. Liquidity ratios – mainly from BS statement • 2. Solvency ratios – mainly from BS statement • 3. Activity ratios - from both BS and P&L statements • 4. Profitability ratios – mainly from P&L. • Ratios from Balance Sheets • A. Liquidity Ratios: Measures ability to meet the day-to-day cash needs of a firm & it concentrates on CA (sources) & CL (uses) – three (3) ratios have been developed. • 1. Current Ratio:Measures CA relative to CL. A value of 1 means CL = CA. Like NWC, it shows the firm's ability to meet its bills in the next period. The larger the ratio ratio the more liquid the firm & vice versa • Current Ratio Year 1: CA$205,0004.94CL $41,500 • Current Ratio Year 2: CA$174,0001.93CL $89,950
2. Quick Ratio:Measures CAless inventories relative to CL & shows the firm's ability to pay bills quickly if inventories cannot be sold. The larger the ratio ratio the more quickly the the firm can pay its bills. • Quick Ratio Year 1: CA - inventories$205,000 – 151,0001.30CL $41,500 • Quick Ratio Year 2: CA - inventories$174,000 – 127,0000.52CL $89,950 • 3. Acid Test Ratio:Measures ability to pay bills tomorrow if inventories & accounts receivable cannot be turned to cash. • Acid Test Ratio Year 1: Cash$49,000 1.18CL $41,500 • Acid Test Ratio Year 2: Cash$17,000 0.19CL $89,950 • In yr 1 AgBiz is extremely liquid, as it had $1.18 in cash for each $ it owed in coming year but this reduced to $0.19 in yr 2.
B. Solvency Ratios: Measures ability to pay debt & its relationships btwn assets, liabilities & equity. Analyzes if firm’s debt or liabilities can be paid off by sale of all assets. Assets> liabilities = solvent • 1. Debt to Equity Ratio or Leverage Ratio. Compares the proportion of financing provided by lenders with that provided by firm owner – i.e. it determines the relative size of creditors' claims to owners' or stockholder’s claim & it’s the ratio of total debt (total liabilities) to owners' equity. • Debt to Equity Ratio Yr 1: Total debt (liabilities)$343,100 0.60Owners equity$567,700 • Debt to Equity Ratio Yr 2: Total debt (liabilities)$410,000 0.67Owners equity$610,000 • When leverage ratio =1, lenders & owners are providing equal portion of financing. Smaller values are preferred to larger ones thus very large leverage ratios result from small equity, meaning an increasing chance of insolvency
2. Debt to Asset Ratio: Measure what part of total assets is owned to lenders. It shd have a value less than 1& smaller values are preferred.Thus ratios > 1 means insolvency. • Debt to Asset Ratio Yr 1: Total debt (liabilities)$343,100 0.38Total Assets$910,800 • Debt to Asset Ratio Yr 2: Total debt (liabilities)$410,000 0.40Total Assets$1,020,000 • 3. The Times Interest Earned Ratio: Lenders are concerned with the level of risk they are assuming when they loan money to firms. One measure of risk is the size of the firm’s pretax earnings relative to the interest payment. These figures can be obtained from the P&L statement. • Int. Earned Ratio Yr 1: Income before tax + interest$36,000+$400010.0Interest paid$4000 • Int. Earned Ratio Yr 1: Income before tax + interest$51,000+$500011.2Interest paid$5000 • In yr 1, there was $10 of income for each & of interest due but this rose to $11 in yr 2. Thus, interest payment is not in jeopardy cos as interest rose, income has risen more.
C. Activity Ratios:Deals with activity of firm with respect to inventory levels, credit payments, & own bill paying. • 1. Inventory Turnover Ratio: Assist mgers determining how much inventory to be kept on hand. One way to measure inventory activity is to calculate number of times inventory is used up or turned over in the year. Its done by dividing COGS (from P&L) by the level of inventory shown on BS. • Inventory Turnover RatioYr 1: COGS$1,026,0006.79inventory level $151,000 • Inventory Turnover RatioYr 2: COGS$1,129,0008.89inventory level $127,000 • In yr 1 inventory turned over 6.79 times & in yr 2 it turned over 8.89 times, thus, the inventory turned over more quickly in year 2 than in year 1
2. Accounts Receivable Turnover Ratio. Measures length of time a firm has to wait to get its money from credit sales. It calculated by dividing credit sales (10% of Sales in our example) by value of accounts receivable • Ac Rec Turnover RatioYr 1: credit Sales$125,00025accounts receivables $5,000 • Ac Rec Turnover RatioYr 2: credit Sales$146,5004.88accounts receivables $30,000 • In yr 1the accounts receivable turned over 25 times or once every 14.6 days, & 4.88 times or once every 74.8 days in yr 2. • Thus, there was a substantial increase in the length of time (14.6 to 74.8 days) required to get money from credit sales. Such a jump requires managers to examine the firm’s credit policies, which may be a source of the liquidity problem.
3. The Accounts Payable Turnover Ratio: Measures how fast the firm pays its own bills. It calculated by dividing credit purchases – e.g. 25% of purchases assumed to be on credit (from P&L statement) by level of accounts payable (from BS) • Ac Payable T/Ratioyr 1:credit purchases$269,25013.5accounts payables $20,000 • Ac Payable T/Ratioyr 1:credit purchases$276,2505.21accounts payables $53,000 • Thus, in yr 2 it took over 2.5 times as long for the firm to pay its bills. This is a serious increase & deserves some mgmt attention as it could have been caused by its liquidity problems.
D. Profitability Ratios: Measures how efficient the firm is in using its resources to produce profit. 3 ratios are presented • 1. Return on Investment Ratio (ROI). Also called return on capital or return on asset. The ROI ratio measures the profit, or return on money invested in the firm, & its relationship btwn before-tax profit (from P&L) & total assets (from BS). • ROI in yr 1: before-tax profit x 100 $36,000 x 100 3.95% total assets $910,800 • ROI in yr 2: before-tax profit x 100 $51,000 x 100 5.00% total assets $1,020,000 • In vr 1 there was a return of 3.95% on monev invested & in yr 2 this rose to 5.00%. Thus, it shows that the firm was using its resources more efficiently in year 2.
2. Return on Owners' Equity Ratio (ROE). The ROI ratio can be misleading as it is a mixture of both debt & equity capita,thus, ROE may be a more appropriate measure of return. It is the ratio of before-tax profit (from P&L) to owners' equity (from BS) • ROI in yr 1: before-tax profit x 100 $36,000 x 100 6.34% owners equity $567,700 • ROI in yr 2: before-tax profit x 100 $51,000 x 100 8.36% owners equity $610,000 • ROE rose from 6.34% in yr 1 to 8.4% in yr 2. This higher return may reflect a good job on the part of mgmt.
3.Profit as a Percentage of Sales Ratio:Measures the profit earned from sales revenue. Its the relationship btwn the before-tax profit & total sales (from P&L) • PPS Ratio yr 1: before-tax profit$36,0002.88% total sales $1,250,000 • PPS Ratio yr 2: before-tax profit$51,0003.48% total sales $1,465,000 • This ratio shows improvement as profit from each dollar of sales revenue rose from $0.0288 in yr 1 to $0.0348. This may reflect good management.