Download
1 / 34
340 likes | 473 Views
The Effects of the Source of Policy Deviation in a Decentralized SC. Joong Y. Son* Chwen Sheu** *MacEwan School of Business Grant MacEwan College **Department of Management Kansas State University Oct. 31, 2008 Research Forum. Contents. Policy Deviation – Examples & Issues

E N D
The Effects of the Source of Policy Deviation in a Decentralized SC Joong Y. Son* Chwen Sheu** *MacEwan School of Business Grant MacEwan College **Department of Management Kansas State University Oct. 31, 2008 Research Forum
Contents • Policy Deviation – Examples & Issues • Research Questions • Literature Review • Model Descriptions • Policy Deviations in a Decentralized SC • Numerical Results & Managerial Implications • Future Research
Examples • Campbell’s winter sales promotion of Chicken noodle soup • Volvo’s special deal on green cars • Cisco’s over-reliance on its forecasting technology and misaligned incentives with partners Mar. 2000 most valuable company, MV of $555 bn May 2001 inventory write-off ($2.2 billion)
Supply Chain Underperformance • Remedies? • SC coordination (Lee & Whang 1999; Klastorin et. al 2002) • Information sharing/ exchange (Cachon & Lariviere 2001; Moinzadeh 2002; Huang et. al 2003) • Team approach in ordering policy (Chen 1999; Chen & Samroengraja 2000) • Who/What is responsible? • Misaligned incentives (Lee & Whang 1999) • Information asymmetry (Corbett & de Groote 2000) • Behavioral causes (Sterman 1987, 1989) • Decentralized and myopic supply chain policies (Croson & Donohue 2002)
Focus of this Research • Coordination (benchmark) vs. Decentralized repl. policies • Benchmark policy: base stock policy at each installation • Cost of policy deviation: decentralized replenishment policies • Order for order policy • MA based • ES based • The impact of deviation based on the source (relative position with SC) • Managerial implications
Research Questions • What are the penalties (local & system-wide) for deviating from the benchmark policy? • Relationships between structural parameters (costs, demand variations) vs. policy parameters (replenishment policies and base stock levels) in a steady state. • What is the relationship between the source (relative position) of deviations and supply chain performance? • Incorporating incentive compatible design (stock outs in SC)
Microeconomics perspective: Radner (1987), Marschak & Radner (1972) SC coordination – incentive compatibility: Jeuland and Shugan (1983), Lee and Rosenblatt (1986), Balakrishnan et al (2004) Information sharing: Lee & Whang (1999), Gilbert & Ballou (1999), Huang et al (2003), Chen et al (2000) Setting: Clark & Scarf (1960), Sterman (1989, 1992), Steckel et al (2004), Chatfield (2004) Replenishment Policies (smoothing algorithms) Dejonckheere et al (2002) Warburton (2004), Balakrishnan (2004) Multi-agent based modeling: Kimbrough et al (2002) Sikora & Shaw (1998) Swaminathan et al (1998) Related Works
Supply Chain Structure A four-stage serial supply chain
Model Settings and Assumptions • A four-stage decentralized serial supply chain • Beer distribution game • Incentive design on stockouts at each station • Based on Clark & Scarf (1960) • Different from Chen’s (1999) “team approach” or “cost centre” • Stockout penalty is incurred at each position • Upstream position is responsible for portion of stockouts at its immediate buyer • Downstream positions have better access to demand information. • In case of policy deviations at multiple stations, deviations are more likely to occur from upstream
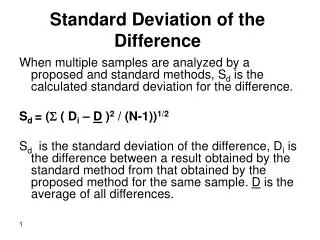
Benchmark Replenishment Policy • Benchmark policy for a four-stage serial supply chain • Base stock policy at each installation with incentive to stock • Minimize long run average supply chain costs • Central coordinator/ planner • Information availability • Base stock level at position i (si) satisfies standard newsvendor results:
Results: Benchmark case • The base stock level and SL at each station increases monotonically in unit backorder cost • The base stock / SL: lowest at the retailer level highest at the factory • Service level remains relatively constant in demand variations • Service level determined directly by the cost structure (bi/hi) • The base stock level increases in demand variations
Policy Deviations Replenishment Scenarios * Benchmark case: Base stock policy at all positions
Policy Deviations • Order for order policy (OFO/ LFL) • Similar to the base stock policy (order = demand) • Moving average based policy • N= 2, 4, 10 • Exponential smoothing based policy • = 0.1, 0.5, 0.9 • Total # of decentralized policies tested = 588 • 2,000 replications over 1,000 weeks
Results: Policy Deviations OFO Base stock vs. OFO
Results: Policy Deviations OFO OFO policy: σ=20, bi=$5.00
Results: Policy Deviations OFO • Deviating station (s): incurred the highest costs • Non-deviating stations: not significantly different from the benchmark case (in fact, slightly lower) • OFO: results in under-stocking at the deviating station (e.g., the distributor) • Unfilled orders downstream lower OH at the wholesaler • The distributor accountable for much of backorders at downstream stations • With high bi, upstream deviation more costly to the entire SC
Results: Policy Deviations-MA based MA2 based σ=20, bi=$5.00
Results: Policy Deviations-MA based MA 10 based: σ=20, bi=$5.00
Results: Policy Deviations-MA based • Shorter MA period, N=2 or 4 • Bigger order sizes and overstocking • Little impact on other stations • Downstream deviations more costly • Longer MA period N=10 • Smoothing effects • Frequent demand-supply misalignment • Deviating party responsible for stock outs at downstream positions • Upstream deviations more costly
Results: Policy Deviations-ES based ES based σ=20, bi=$5.00
Results: Policy Deviations-ES based • Consistent with MA based results • Small α=0.1 • Significant under-stocking at the deviating station demand – supply timing mismatch high stock-out penalties • Benefit from low OH outweighed by huge stock-out penalty borne by the deviating station • Large α=0.5, 0.9 • Overstocking at the deviating station • Downstream deviations more costly
Results: % increase SC costwith Policy Deviations • Potential cost savings for the SC by implementing the benchmark case
Results: % increase SC costPolicy Deviations - OFO OFO based σ=20
Results: % increase SC costPolicy Deviations – ES based ES based σ=20, α=0.9
Results: % increase in SC cost • Order-for-order based policy • Tendency to understock • With high bi higher potential savings staying with BS • MA with small N/ ES with high α • Overstock • Downstream deviation costly • With high bi potential savings lower with BS
Managerial Implications • In a steady state, OFO policy deviations (from the benchmark base stock policy) at a given station result in • Under-stocking at the deviating station • Higher costs at the deviating station • Non-deviating stations may benefit • Especially at an immediate downstream position • Some cases result in local costs lower than the benchmark
Managerial Implications • Decentralized policies with greater smoothing effects (larger N for MA, and smaller for ES) tend to • Display significant under-stocking/ misaligned D-S • Result in the worst SC performance both locally and globally (could be parameter-specific) • Decentralized policies with higher responsiveness (smaller N for MA and greater for ES) exhibit • Overstocking • Relatively strong SC performance
Managerial Implications • Downstream positions (e.g. the retailer or the wholesaler) have incentive NOT to share demand information with others • When others deviate, the retailer exhibits the lowest local cost (even lower than the benchmark case) • Need incentive compatible mechanism in SC to have the retailer share demand information with the rest of the stations • Regardless of policy deviations at other stations • Staying with base stock policy warrants local protection against deviations at other positions
Managerial Implications • Regardless of whether companies have seemingly perfect operations or not, it is crucial for parties to coordinate and share information (Booker, 2001) • Think globally, act locally!
Future Research • Supply chain design • Multiple stations at each stage • Determining the number of buyers and suppliers • Degree of heterogeneity of buyers and suppliers • Incorporating risk pooling and other coordination mechanisms (e.g. revenue sharing)